
[Editor’s note: This is Joel A. Harrison, PhD, MPH second guest post. Dr. Harrison’s papers involve much longer in-depth analyses than usual blog posts, so we are posting both a “short version” and later the “long version”. Note that a downloadable PDF version of complete paper, including a detailed reference list, can be accessed here.]

From early childhood, though enjoying Sherlock Holmes, H.G. Wells, Jules Verne, and other works of fiction, I especially liked reading history and science, subscribing to the old adage that “truth is stranger than fiction.” Then I read a book that had a profound effect on me, William H. McNeil’s 1976 Plagues and Peoples. McNeil made a compelling case that much of human history has been determined not by great statesmen, nor military leaders, nor technology; but by the lowly microbe. In the 40 years since then I have read dozens of books and hundreds of articles on each of various infectious diseases from plague to smallpox to influenza to polio, numerous histories of each, their current status around the world, and, of course, their epidemiology. And along the way did graduate work in epidemiology, biostatistics, and read numerous textbooks and articles and audited courses on microbiology and immunology.
I am writing this article not only because polio seems to be one of the antivaccinationists’ favorite topics, which they often use to demonstrate to their uninformed readers the evils of vaccines and national vaccination programs (e.g., Adams. 2018; Child Health Safety, 2018; Olmsted, 2011, Olmsted, 2016; VacTruth, 2018; whale to, 2018); but also because polio has a special significance for me. As a child I remember my mother not allowing me to go to the local municipal swimming pool nor to the movies during polio season. In my elementary school was a little girl with a steel brace on one leg. During my life I have known several paraplegics. One, in particular, the older sister of one of my oldest dearest friends, met a man in the late 1980s who had been in an iron lung for almost 40 years, and several people who suffered from post-polio syndrome. And through my readings I discovered that my hometown, San Diego, had a major epidemic of polio in 1951 and being in the first cohort to receive the new Salk vaccine, I more than likely received a dose from a lot manufactured by Cutter Industries which because of poor production and quality control caused 204 cases of paralytic polio and 10 deaths (to be discussed in a later paper). So, fortunately, I dodged at least two bullets.
Unfortunate incidents and avoidable errors do occur; but these rare events should not be the basis on which to decide the merit of things like public health programs, as some, including Suzanne Humphries and Roman Bystrianyk in their book Dissolving Illusions, have attempted. Even more egregious is the attempt to take a monumentally significant public health issue like polio and, using “alternative facts”, minimize its significance, going so far as to claim that polio was an “insignificant” disease. This paper will show their total lack of credibility.
Incidence, mortality, disability, suffering: Comparing apples to oranges
From Humphries:
Prevalence of polio, 1912–1969
Since the early 1900s, we have been indoctrinated to believe that polio was a highly prevalent and contagious disease. Graph 12.1 depicts the incidence of various diseases in the United States between 1912 and 1970. Poliomyelitis is the line (with square points) at the bottom and reveals that the incidence was very low when compared to that of other infectious diseases. Polio has also been portrayed as a vicious crippler in the early and mid-1900s when it was habitually diagnosed by doctors who used a very loose definition of the disease. This graph denotes rates of clinical disease, most of which resolved and left no residual paralysis at all.
Given what a low-incidence disease it was, how did polio come to be perceived as such an infamous monster? This is a question worthy of consideration, especially in light of the fact that the rate was far less than other common diseases, some of which declined in incidence to nearly zero with no vaccine at all. Those who still embody a fear of polio may argue that it was a monster because it crippled people, especially children. But it was later revealed, after a vaccine was lauded for the eradication of polio, that much of the crippling was related to factors other than poliovirus, and those factors could not possibly have been affected by any vaccine (pp. 212-213).
Graph 12.1 referenced in the quote above is copied below as Figure 1. Note, that as the graph appears in her book, it is difficult to discern by color which of the lines represent which disease, so I have included a red arrow to indicate the line representing poliomyelitis. The data Humphries used to produce this graph is in Table 1 below Figure 1.
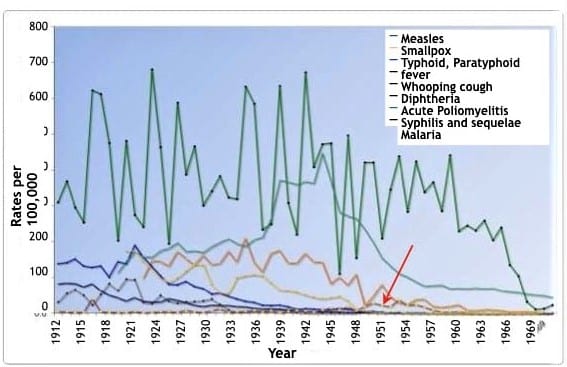
Table 1: Rates Per 100,000 Population for Specified Reportable Diseases: 1912 to 1970. Historical Statistics of the United States: Colonial Times to 1970, Part 1. Bureau of the Census (1970), p. 77.
| Year | Disease incidence per 100,000 population | |||||||
| Syphillis | Malaria | Typhoid | Diptheria | Pertussis | Measles | Poliomyleitis | Smallpox | |
| 1970 | 43.8 | 1.5 | 0.2 | 0.2 | 2.1 | 23.2 | <0.5 | |
| 1969 | 48.1 | 1.5 | 0.2 | 0.1 | 1.6 | 12.8 | <0.5 | |
| 1968 | 49.9 | 1.2 | 0.2 | 0.1 | 2 .4 | 11.l | <0.5 | |
| 1967 | 53.2 | 1.0 | 0.2 | 0.1 | 4 .9 | 31.7 | <0.5 | |
| 1966 | 57.1 | 0.3 | 0.2 | 0.1 | 3.9 | 104.2 | 0.1 | |
| 1965 | 59.7 | 0.1 | 0.2 | 0.1 | 3.5 | 135.1 | <0.5 | |
| 1964 | 62 .9 | <0.5 | 0.3 | 0.2 | 6.8 | 239.4 | 0.1 | |
| 1963 | 69.8 | 0.1 | 0.3 | 0.2 | 9.1 | 204.2 | 0.2 | |
| 1962 | 68.1 | 0.1 | 0.3 | 0.2 | 9.6 | 259.0 | 0.5 | |
| 1961 | 69.7 | <0.5 | 0.4 | 0.3 | 6.3 | 231.6 | 0.7 | |
| 1960 | 68.0 | <0.5 | 0.5 | 0.5 | 8.3 | 245.4 | 1.8 | |
| 1959 | 69.3 | <0.5 | 0.5 | 0.5 | 22.7 | 230.1 | 4.8 | |
| 1958 | 68.5 | <0.5 | 0.6 | 0.5 | 18.6 | 440.5 | 8.3 | |
| 1957 | 78.8 | 0.1 | 0.7 | 0.7 | 16.6 | 285.9 | 3.2 | |
| 1956 | 77.1 | 0.1 | 1.0 | 0.9 | 19.0 | 865.9 | 9.1 | |
| 1955 | 76.0 | 0.3 | 1.0 | 1.2 | 38.2 | 337.9 | 17.6 | |
| 1954 | 87.5 | 0.4 | 1.3 | 1.3 | 37.8 | 423.5 | 23.9 | |
| 1953 | 100.8 | 0.8 | 1.4 | 1.5 | 23.5 | 283.7 | 22.5 | |
| 1952 | 110.8 | 4.5 | 1.5 | 1.9 | 28.9 | 438.5 | 87.2 | |
| 1951 | 131.8 | 3.7 | 1.4 | 2.6 | 44.8 | 345.6 | 18.5 | |
| 1950 | 154.2 | 1.4 | 1.6 | 3.8 | 80.1 | 210.1 | 22.1 | |
| 1949 | 197.3 | 2 .8 | 2.7 | 5.4 | 46.7 | 420.6 | 28.3 | <0.5 |
| 1948 | 234.7 | 6 .6 | 2.5 | 6 .5 | 51.1 | 421.0 | 19.0 | <0.5 |
| 1947 | 264.6 | 10.5 | 2.8 | 8.5 | 109.1 | 155.0 | 7.5 | 0.1 |
| 1946 | 271.7 | 34.7 | 2.8 | 11.7 | 78.4 | 496 .8 | 18.3 | 0.2 |
| 1945 | 282.3 | 47 .4 | 3.7 | 14.1 | 101.0 | 110.2 | 10.3 | 0.3 |
| 1944 | 867 .9 | 43.4 | 4.0 | 10.6 | 82.7 | 474.3 | 14.3 | 0.3 |
| 1943 | 447 .0 | 40.6 | 4.1 | 11.0 | 142 .9 | 472.0 | 9.3 | 0.6 |
| 1942 | 363.4 | 44.9 | 4.6 | 12.1 | 142.9 | 408.8 | 8.1 | 0.6 |
| 1941 | 368.2 | 51.1 | 6.5 | 13.5 | 166.9 | 671.7 | 6.8 | 1.0 |
| 1940 | 359.7 | 59 .2 | 7.4 | 11.8 | 139.6 | 220.7 | 7 .4 | 2.1 |
| 1939 | 367 .1 | 63.2 | 10.0 | 18.4 | 140.0 | 308.2 | 5.6 | 7.5 |
| 1938 | 372.0 | 64.9 | 11.5 | 23.5 | 175.1 | 633.8 | 1.3 | 11.5 |
| 1937 | 264.8 | 84.2 | 12.4 | 22 .2 | 166.6 | 249.6 | 7 .4 | 9.1 |
| 1936 | 212.6 | 104.6 | 12.4 | 23.4 | 115.0 | 284.0 | 3.5 | 6.1 |
| 1935 | 205.6 | 108.1 | 14.4 | 30.8 | 141.9 | 584.6 | 8.5 | 6.8 |
| 1934 | 186.7 | 105.4 | 17.6 | 34.1 | 209.9 | 632.6 | 5.9 | 4.8 |
| 1933 | 193.4 | 100.0 | 18.6 | 40.2 | 142.6 | 319.2 | 4.0 | 5.2 |
| 1932 | 208.2 | 55.0 | 21.4 | 48.0 | 172.5 | 323.2 | 3.1 | 9.0 |
| 1931 | 197 .4 | 56.7 | 21.4 | 57.1 | 139.l | 382.8 | 12.8 | 24.4 |
| 1930 | 185.4 | 80.0 | 22.1 | 54.1 | 135.6 | 340.8 | 7.5 | 39.7 |
| 1929 | 169.2 | 134.7 | 19.1 | 70.1 | 162.l | 300.6 | 2.4 | 34.7 |
| 1928 | 174.2 | 138.2 | 22.6 | 75.9 | 134.3 | 466.3 | 4.3 | 32.7 |
| 1927 | 171.9 | 118.2 | 29.2 | 89.8 | 152.4 | 387.6 | 8.8 | 31.6 |
| 1926 | 196 .1 | 98.9 | 35.5 | 80.7 | 172.2 | 587.1 | 2.3 | 28.7 |
| 1925 | 181.2 | 86.8 | 40.0 | 82.1 | 131.2 | 194.3 | 5.3 | 84.2 |
| 1924 | 174 .2 | 98.4 | 31.0 | 105.6 | 145.0 | 463.7 | 4.6 | 49.6 |
| 1923 | 156 .2 | 124.2 | 31.0 | 131.4 | 146.7 | 680.0 | 3.1 | 27 .6 |
| 1922 | 157 .7 | 142.9 | 33.0 | 156 .9 | 97.7 | 241.8 | 2.0 | 30.8 |
| 1921 | 172.3 | 174 .7 | 43.5 | 190.7 | 274.6 | 5.8 | 94.7 | |
| 1920 | 145.3 | 173.0 | 33.8 | 139.0 | 480.5 | 2.2 | 95.9 | |
| 1919 | 113 .2 | 42.9 | 144.7 | 203.2 | 2.8 | 68.8 | ||
| 1918 | 50.0 | 101.5 | 474.9 | 2.8 | 83.1 | |||
| 1917 | 63.0 | 183.0 | 611.6 | 4.9 | 52.7 | |||
| 1916 | 82.3 | 129.2 | 621.8 | 41.1 | 23.4 | |||
| 1915 | 74.0 | 132.7 | 254.1 | 8.1 | 50.2 | |||
| 1914 | 82.4 | 152.5 | 295.8 | 2.4 | 66.4 | |||
| 1913 | 84.2 | 142.1 | 368.5 | 4.0 | 55.7 | |||
| 1912 | 81.8 | 139.0 | 310.0 | 5.5 | 30.8 | |||
Note that between years 1944 through 1955 (BOLDED), this table shows much more clearly than Figure 1 that the incidence of poliomyelitis was increasing. However, it is not the incidence of a disease that is most relevant, otherwise all the diseases included in Humphries graph pale compared to the common cold and even food poisoning, which an estimated 1 in 6 Americans (48 million people) get every year, resulting in 128,000 hospitalizations, and 3,000 deaths (CDC. Burden of Foodborne Illnesses). What is important are:
- Degree of suffering
- Disability
- Mortality
- Mode of transmission
- Factors affecting the above (e.g., public health measures)
This abbreviated post (see full pdf version for details) will show that despite changing definitions of paralytic poliomyelitis and errors in misdiagnosis, the majority of cases were correctly diagnosed and, actually, the total number of cases of those infected with and affected by the polio virus was more than likely underestimated. Typhoid fever, caused by a bacterium, was basically eliminated by clean water, and other public health measures. Malaria, a mosquito-borne protozoon, was ended in the US by mainly economic changes together with public health measures. Syphilis is still a problem because it depends on human behavior. Diphtheria began its decline, perhaps based on mutating to a less virulent form, with, first, an anti-toxin and then a toxoid vaccine contributing to its further decline. Deaths from measles, a virus, were significantly reduced, reaching an asymptote of an average of 450 per year during the 1950s; but with a substantial amount of suffering, 45,000 hospitalizations, and up to 250 permanently disabled children. Given that the number of cases were underreported, the possibility exists that deaths were also underreported. Smallpox deaths were reduced to under 1% in the United States, except imported cases, by a variant of the virus, although variola minor still entailed quite a bit of suffering, and, as long as variola major reigned in much of the world, the risk to Americans neither vaccinated nor exposed to variola minor still existed. Whooping cough (pertussis), caused by a bacteria, was reduced and almost eliminated in the United States by vaccines. In addition, while Humphries figure uses incidence, I think most people would care more about the degree of suffering, deaths, and disabilities. And ALL of the above, except syphilis began declining, some as early as the late 19th century. Though deaths from pertussis, measles, and diphtheria continued from the end of World War II into the early 1950s, they were lower than earlier and continued their decline, while polio was on the ascendance, including both deaths and disability.
Poliomyelitis: Epidemics, Incidence, Morbidity (paralysis), and Mortality
According to the CDC Pink Book chapter on poliomyelitis:
Fewer than 1% of all polio infections in children result in flaccid paralysis. Patients do not experience sensory losses or changes in cognition. Many persons with paralytic poliomyelitis recover completely and, in most, muscle function returns to some degree. Person-to-person spread of poliovirus via the fecal-oral route is the most important route of transmission, although the oral-oral route is possible.
While the other diseases in Humphries graph were on the decline, polio was on the rise. (Trevelyan, 2005, pp. 35-36).
Humphries argues in her chapter that even the classification of these cases is suspect, lacking laboratory confirmation, and changing criteria for defining paralysis. The fact that some cases were misdiagnosed is not questioned, something one finds in all aspects of medicine; but, as I will show, the vast majority of cases reported as polio were polio!
Polio mortality
First, let’s look at deaths, something even Humphries can’t claim were misdiagnosed. The following table is from the CDC Pink Book Appendix E; it allows one to compare death rates from several of the diseases used in Humphries’ comparison graph. The table also includes paralytic cases separately starting in 1951. Appendix E only listed total cases for 1951-1953, so I added in parentheses the number of reported paralytic cases (Post-Polio Health International.
Table 2: Reported cases and deaths from vaccine preventable diseases, United States, 1950-1982
| Measles | Diphtheria | Pertussis | Polio (paralytic)
†Total reported cases From 1951, MMWR separated paralytic and nonparalytic cases. Before 1951, MMWR included both as Total Cases. |
|||||
| Year | Cases | Deaths | Cases | Deaths | Cases | Deaths | Cases | Deaths |
| 1950 | 319,124 | 468 | 5,796 | 410 | 120,718 | 1,118 | 33,300† | 1,904 |
| 1951 | 530,118 | 683 | 3,983 | 302 | 68,687 | 951 | 28,386†
(10,037) |
1,551 |
| 1952 | 683,077 | 618 | 2,960 | 217 | 45,030 | 402 | 57,879†
(21,269) |
3,145 |
| 1953 | 449,146 | 462 | 2,355 | 156 | 37,129 | 270 | 35,592†
(15,648) |
1,450 |
| 1954 | 682,720 | 518 | 2,041 | 145 | 60,886 | 373 | 18,308 | 1,368 |
| 1955 | 555,156 | 345 | 1,984 | 150 | 62,786 | 467 | 13,850 | 1043 |
| 1956 | 611,936 | 530 | 1,568 | 103 | 31,732 | 266 | 7,911 | 566 |
| 1957 | 486,799 | 389 | 1,211 | 81 | 28,295 | 183 | 2,499 | 221 |
| 1958 | 763,094 | 552 | 918 | 74 | 32,148 | 177 | 3,697 | 255 |
| 1959 | 406,162 | 385 | 934 | 72 | 40,005 | 269 | 6,289 | 454 |
| 1960 | 441,703 | 380 | 918 | 69 | 14,809 | 118 | 2,525 | 230 |
| 1960 | 423,919 | 434 | 617 | 68 | 11,468 | 76 | 988 | 90 |
| 1962 | 481,530 | 408 | 444 | 41 | 17,749 | 83 | 762 | 60 |
| 1963 | 385,156 | 364 | 314 | 45 | 17,135 | 115 | 396 | 41 |
| 1964 | 458,083 | 421 | 293 | 42 | 13,005 | 93 | 106 | 17 |
| 1965 | 261,904 | 276 | 164 | 18 | 6,799 | 55 | 61 | 16 |
| 1966 | 204,136 | 261 | 209 | 20 | 7,717 | 49 | 106 | 9 |
| 1967 | 62,705 | 81 | 219 | 32 | 9,718 | 37 | 40 | 16 |
| 1968 | 22,231 | 24 | 260 | 30 | 4,810 | 36 | 53 | 24 |
| 1969 | 25,826 | 41 | 241 | 25 | 3,285 | 13 | 18 | 13 |
| 1970 | 47,351 | 89 | 435 | 30 | 4,249 | 12 | 31 | 7 |
| 1971 | 75,290 | 90 | 215 | 13 | 3036 | 18 | 17 | 18 |
| 1972 | 32,275 | 24 | 152 | 10 | 3,287 | 6 | 29 | 2 |
| 1973 | 26,690 | 23 | 228 | 10 | 1,759 | 5 | 7 | 10 |
| 1974 | 22,094 | 20 | 272 | 5 | 2,402 | 14 | 7 | 3 |
| 1975 | 24,374 | 20 | 307 | 5 | 1,738 | 8 | 13 | 9 |
| 1976 | 41,126 | 12 | 128 | 7 | 1,010 | 7 | 10 | 16 |
| 1977 | 57,345 | 15 | 84 | 5 | 2,177 | 10 | 19 | 16 |
| 1978 | 26,871 | 11 | 76 | 4 | 2,063 | 6 | 8 | 13 |
| 1979 | 13,597 | 6 | 59 | 1 | 1,623 | 6 | 22 | 1 |
| 1980 | 13,506 | 11 | 3 | 1 | 1,730 | 11 | 9 | 2 |
| 1981 | 3,124 | 2 | 5 | 0 | 1,248 | 6 | 10 | 0 |
| 1982 | 1714 | 2 | 2 | 1 | 1,895 | 4 | 12 | 0 |
The number of deaths from polio was substantially higher from 1950-1956 than any of the other disease. Perhaps, as from 1953, Humphries doesn’t consider 3,145 deaths from polio, mainly children, of any importance? Note that number 2 in number of deaths from 1950 on was measles, with a high of 683 in 1951, just a minor blip on the screen according to Humphries (p.174).
Polio morbidity/paralysis
Though “fewer than 1% of all polio infections in children result in flaccid paralysis and most did eventually regain some or complete mobility”, given the large number infected during epidemics, this was a substantial number. In addition, as polio doesn’t affect the sensory nerves, many suffered intense pain and months to years to recover (e.g., Sass, 1996; Seavey, 1998; Silver, 2007).
Humphries writes:
The practice among doctors before 1954 was to diagnose all patients who experienced even short-term paralysis (24 hours) with “polio.” In 1955, the year the Salk vaccine was released, the diagnostic criteria became much more stringent. If there was no residual paralysis 60 days after onset, the disease was not considered to be paralytic polio. This change made a huge difference in the documented prevalence of paralytic polio because most people who experience paralysis recover prior to 60 days (Humphries, p. 219).
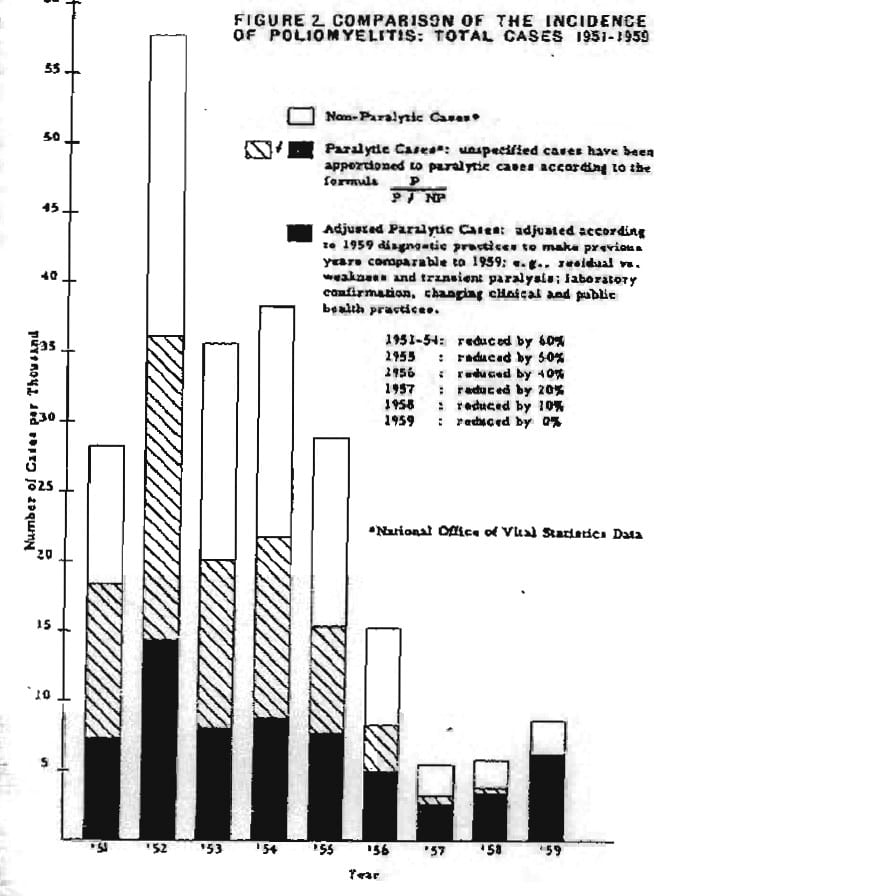
Humphries basis the above on Dr. Greenberg (see below); however, even with Greenberg’s adjustments there remained a substantial number of paralytic cases, e.g., 1951 (7,000), 1952 (14,000) (Ratner, 1960, p. 5). Note the black portion of each bar.
Dr. Greenberg’s chart showing what the incidence, total cases of paralytic polio would have been in former years if the diagnostic criteria of 1959 had been used (from Ratner, 1960, p. 5).
Humphries goes on to write:
As a case in point on how much paralytic disease thought to be polio was not at all associated with polioviruses, consider the well-documented Michigan epidemic of 1958. This epidemic occurred four years into the Salk vaccine campaign. An in-depth analysis of the diagnosed cases revealed that more than half of them were not poliovirus associated at all…In a large number of paralytic as well as nonparalytic patients poliovirus was not the cause (Humphries, p. 219).
Let’s look at the actual data from the Michigan study; but first, according to Brown (1960):
An additional correlation of clinical and laboratory information was made possible by the fact that 550 of the patients in the Detroit area were examined for muscles weakness 60 days after onset of disease. The results are presented in table 7 [Table 5 below] in terms of the degree of paralysis two months after infections, and they are arranged according to the clinical diagnosis at the time of admission to hospital and according to the results of laboratory tests carried out on specimens from these patients. It is obvious that most of the 308 patients considered to be nonparalytic on admission were also classified in that category two months later. Virus was isolated from only one-half of those among whom ECHO and Coxsackie viruses were equally responsible with poliovirus for the infections. Among the 242 patients originally diagnosed as paralytic, 187, or 77% were confirmed by laboratory tests to have poliomyelitis. The vast majority of these (84%) were found to have residual paralysis 60 days after onset of the illness, and it is of interest that 83% of these paralytic patients were unvaccinated and only four, or 2.5%, had received three doses of vaccine.
Table 3: Correlation of Laboratory Findings of Poliomyelitis with Muscle Examination Performed 60 Days from Onset of Illness (from Table 7 in Brown, 1960)
| Original Diagnosis | Laboratory Diagnosis | Results of Muscle Examination, No. | |||||
| Type | No. | Type | No. | NP* | P1a | P2b | P3c |
| Nonparalytic | 308 | Polio | 66 | 56 | 4 | 1 | 3 |
| ECHO | 53 | 52 | 1 | . . . | . . . | ||
| Coxsackie | 41 | 40 | . . . | 1 | . . . | ||
| Negative | 148 | 143 | 5 | . . . | . . . | ||
| Paralytic | 242 | Polio | 187 | 29 | 49 | 67 | 42 |
| ECHO | 2 | . . . | 2 | . . . | . . . | ||
| Negative | 53 | 20 | 11 | 15 | 7 | ||
* NP = non paralytic
a P1 = minor involvement
b P2 = significant paralysis
c P3 = severe paralysis or death
Just to be clear, the changed definition of paralytic cases explained by Greenberg did eliminate a substantial number of cases of paralysis; but a significant number of paralytic cases remained and in the following years, based on the revised definition, following the introduction of the vaccine, these numbers continued to decline until there were none, so, whatever some claim, the evidence for the effectiveness of the vaccine is substantial and undeniable and the Brown paper, based on lab confirmation and 60 day confirmed paralytic cases, found the majority were caused by polio.
And finally, Bruno makes a compelling case that the total number of people infected with the virus, even some with mild paralysis, was actually underestimated. (Bruno, 2000).
Humphries continues her callous dismissal of the cases of paralytic poliomyelitis;
Wild poliovirus was never the big killer or paralyzer the public was led to believe it was through the many frightening images shown repeatedly in the 1950s. Dr. Lennette, a well-respected virologist and pioneer of diagnostic virology with the California Department of Health, said in reflection on September 1987:
Actually, economically the disease wasn’t very important. Secondly, not many cases were seen in this country. There weren’t too many people paralyzed from polio in any one neighborhood, so it never made much of an impact (Humphries, p. 224).
For a little perspective, according to the National Cancer Institute:
Among children ages 0 to 14 years, it is estimated that 10,270 will be diagnosed with cancer and 1,190 will die of the disease in 2017 (National Cancer Institute, 2017).
For cerebral palsy, according to the Texas Adoption Resource Exchange:
About 8,000 babies and infants are diagnosed with the condition each year. In addition, some 1,200 – 1,500 preschool age children are recognized each year to have cerebral palsy (Texas Adoption Resource Exchange, 2018).
And approximately 4,531 new cases of muscular dystrophy are reported in the U.S. per year. Given the large number of neighborhoods in the US, the likelihood of one, let alone more of any of the above in a neighborhood is small. Yet, many Americans were and are aware of them and support efforts, both research and care.
So, Americans, even if not in their neighborhoods, were reminded of just how serious a condition paralytic poliomyelitis was as with other “low incidence” childhood diseases and disabilities. Keep in mind that from the 1916 epidemic on many neighborhoods had witnessed first-hand paralytic poliomyelitis.
So if polio, with 7,000 documented cases of paralysis or more, should be dismissed as unimportant, I wonder which one of the above and many other disabilities and diseases affecting mainly children, given their “low incidence,” does Humphries also think we should ignore?
Why did the American people view polio with such fear?
This is a good reason to be afraid of polio.
According to Oshinsky:
The disease reached its peak at the height of the cold war, when a national crisis often took the form of a crusade. And this particular crisis, an epidemic targeting defenseless children, grew to increasingly dramatic proportions in an increasingly suburban, family-oriented society preaching ever-higher standards of protection for the young. How ironic, how unfair, that polio seemed to target the world’s most advanced nation, where new wonder drugs like penicillin were readily available and consumers—mainly housewives—worked overtime to eliminate odors and germs.
No disease drew as much attention, or struck the same terror, as polio. And for good reason. Polio hit without warning. There was no way of telling who would get it and who would be spared. It killed some of its victims and marked others for life, leaving behind vivid reminders for all to see: wheelchairs, crutches, leg braces, breathing devices, deformed limbs (Oshinsky, 2005, pp. 4-5).
The March of Dimes
According to Humphries: “The March of Dimes campaigns . . . were . . . designed to impact human fear and emotion (Humphries, p.224).”
According to Oshinsky: “This dread did not begin with the National Foundation. A growing pattern of epidemics—the worst occurring in 1916—had already drawn . . . notice in the press (Oshinsky, 2005, p. 5).”
This was a time before the U.S. Government became actively involved in funding a broad range of medical programs. And few people had medical insurance.
According to Rose:
During its first 20 years, the Foundation assisted over 335,000 individuals with polio in a patients aid program that covered medical, hospital, and rehabilitation expenses. . . Covered expenses included payment for physician services, inpatient and outpatient hospital costs, the transport of polio patients (local transport to hospitals and the Military Air Transport Services, or MATS, organized through the US Air Force, home care (including nursing care), orthopedic devices, and home medical equipment. Rehabilitation expenses often involved long-term home care and carried over from year to year beyond the addition of new cases. . . The Foundation claimed that it was “the only voluntary health agency in the US which conducts a nationwide program of financial assistance to patients in meeting the costs of care of a single disease.”
It is important to recall the direct aid to communities besides personal aid that might have been beyond the scope of personal appreciation by individual recipients. From the outset the NFIP [the National Foundation for Infantile Paralysis, more commonly known as the March of Dimes] had organized systematic epidemic relief in concert with public health authorities involving the dispatch of physicians, nurses, and epidemiologists to affected areas, with medical equipment and supplies, to cope with local polio epidemics. It had supported the helping professions intrinsically involved with after care: nursing, physical therapy, and occupational therapy (Rose, 2016, pp. 156-158).
Only about 16% of the funds collected by the March of Dimes went to research and vaccine development, thus, approximately 84% went to care, education, and equipment (Van Riper, 1955, p. 141).
A low incidence relative to many other disease, yes; but incidence is not the important factor – suffering, disability, and death are. Even after Greenberg’s adjustments for determining paralysis, after Brown’s laboratory analyses distinguishing polio case from others, what remained were a significant number of deaths and even more so, the ever present specter of an ever increasing number of disabled children. Without the National Foundation, how would they have been cared for?
Estimates of probability of children permanently paralyzed
Humphries writes:
The CDC defines polio’s statistical paralytic rate and estimates that it is less than 1 in 100 for some sort of permanent paralytic syndrome. . .Prior to vaccination, Dr. Maurice Brodie reported that only 1 in 170 children with no antibody to polio became ill during epidemics. By these two drastically different risk estimations, you can see that statistics are not set in stone, nor are they necessarily a reliable indicator of risk (Humphries, pp. 239-240; see also: Brodie,1936).”
Unfortunately, Humphries fails to understand that at the time Brodie conducted his study it was not known that polio consisted of three identifiable serotypes, so, the antibodies used in Brodies analysis probably recognized only one of the serotypes. In other words, many of the children who tested negative may well have had antibodies to one or both of the other serotypes. In addition, Humphries fails to understand that almost all studies of any specific medical area will find a range of statistics. In the case of polio, for instance, it would depend on time, place, sampling scheme, sample size for any lab estimates, and, of course, which of the serotypes exist or have existed. However, whether one needed to vaccinate 100 or even 200 to prevent one case of paralysis (the number needed to treat), given the significant number of paralytic cases depends on whether one considers so many paralyzed individuals acceptable or not, especially given the documented safety of the vaccines.
Far more people were harmed by polio than originally suspected
Post-polio syndrome
According to Wikipedia:
Post-polio syndrome is a condition that affects approximately 25–50% of people who have previously contracted poliomyelitis—a viral infection of the nervous system—after the initial infection. Typically the symptoms appear 15–30 years after recovery from the original paralytic attack, at an age of 35 to 60. Symptoms include acute or increased muscular weakness, pain in the muscles, and fatigue. The same symptoms may also occur years after a nonparalytic polio (NPP) infection [my emphasis].
Poliovirus attacks specific neurons resulting in the death of a substantial fraction of the motor neurons controlling skeletal muscles. In an effort to compensate for the loss of these neurons, surviving motor neurons sprout new nerve terminals to the orphaned muscle fibers. The result is some recovery of movement and the development of enlarged motor units.
With age, most people experience a decrease in the number of spinal motor neurons. Because polio survivors have already lost a considerable number of motor neurons, further age-related loss of neurons may contribute substantially to new muscle weakness. (Wikipedia. Post-polio syndrome; see also: Halstead, 1998; Halstead, 2011; Horowitz, 1985; March of Dimes, 2001; McComas, 1997).
Studies have found clear evidence of polio virus in sufferers of post-polio syndrome (e.g., Leparc-Goffart, 1996).
Not only those who suffered paralysis, going through often long painful therapies, who appeared to have regained somewhat normal mobility, eventually only to develop post-polio syndrome; but a number of those, who following an acute episode of polio, even those asymptomatic, also developed post-polio syndrome. As discussed by Bruno:
Recent studies make clear that [non-paralytic polio] survivors do have late onset symptoms. Therefore, “postpolio syndrome” should not be used as the generic descriptor for late onset problems in polio survivors, because its diagnostic criteria exclude those without a history of paralysis, electromyographic evidence of denervation, and new muscle weakness. (Bruno, 2000; see also: Falconer, 2000, Nee, 1995).
Bruno further writes:
In the 1940s Johns Hopkins University pathologist David Bodian found that 96 percent of motor neurons were infected by the poliovirus if you had any paralysis at all! Bodian found that for each neuron the polio virus invades, commandeers, and destroys, its action is halted in another neuron. How is it that the poliovirus is stopped at least half the time? Most likely because the immune system is able to play catch-up and produce enough antibodies to attack the poliovirus before it conquers the entire nervous system.
But if on average 50 percent of all motor neurons are destroyed in anyone who had paralytic polio, why aren’t half of polio survivor’s muscles paralyzed? Bodian discovered that at least 60 % of spinal cord motor neurons associated with an individual muscle must be killed before the muscle shows any weakness at all. This means that muscles that were at one time paralyzed or muscles that have been weak, may have been operating on as few as 40 percent of their original motor neurons. . . What’s more, Bodian found that muscles thought to be completely unaffected by polio—muscles that had never been weak, let alone paralyzed—only have 60% of their motor neurons (Bruno, 2002, p. 29).
What’s more, Bruno makes a case that, besides post-polio syndrome, chronic fatigue syndrome may have the same pathophysiology (Bruno, 1997; Bruno, 1998).
So, the 1/100 to 1/200 ratio that describes the immediate aftermath of acute polio infection significantly underestimates the “true” extent of polio’s damage. Many cases of slight muscle weakness were missed and later those suffering from post-polio syndrome, both originally asymptomatic and symptomatic, and, perhaps, even chronic fatigue syndrome, were the result of the polio virus.
Humphries writes:
After the vaccine, there was a concerted effort to distinguish cases with poliovirus from cases without it. This was not a concern prior to 1958 when many diseases common today hid behind the name poliomyelitis. Transverse myelitis, viral or aseptic meningitis, Guillain-Barré syndrome (GBS), chronic fatigue syndrome, spinal meningitis, post-polio syndrome, acute flaccid paralysis (AFP), enteroviral encephalopathy, traumatic neuritis, Reye’s syndrome, etc., all could have been diagnosed as polio prior to 1958 (Humphries, p. 224).
As discussed above, after Greenberg’s adjustments for determining paralysis, and using the same criteria together with laboratory differential diagnostics in Brown’s study, a significant number of cases of paralytic poliomyelitis remained. And neither post-polio syndrome nor chronic fatigue syndrome were known entities until decades later, so how could they be diagnosed as polio prior to 1958? And Humphries appears unaware that not only did the polio virus cause immediate cases of disability; but has been found to have resulted in “mild” effects on many during their lifetime and later disabilities, even those who did not initially appear to have been affected. Humphries seems unaware of just how much damage to neurons poliovirus did.
Summary and conclusion
I think it obvious that Humphries presentation is defective in numerous ways and displays a callousness towards suffering:
- Humphries begins by comparing incidence rates for a number of diseases, essentially comparing apples to oranges;
- When Humphries does discuss disease incidence and deaths, she ignores the tremendous toll polio has in terms of suffering and disability, something she does as well with measles;
- Humphries ignores that all the diseases she compared with polio were either already eliminated or on a sharp decline at the same time polio was on the ascendance;
- Whether 1/100 or 1/200 cases actually became paralyzed, when one counts up the actual number of cases of paralyses, it makes little difference;
- Humphries dismisses that even after Greenberg’s adjustments, 7,000 or more cases of paralysis remained;
- Humphries misuses the Michigan data, which actually found “among the 242 patients originally diagnosed as paralytic, 187, or 77% were confirmed by laboratory tests to have poliomyelitis. The vast majority of these (84%) were found to have residual paralysis 60 days after onset of the illness”, thus, 65% had paralysis 60 days later;
- And, though, as exemplified by Greenberg and the Michigan study, changing definitions and mistakes in differential diagnosis, Humphries ignores the fact that the actual number of people reported to be affected by the polio virus is a significant underestimate, and that many suffered mild decrements in ability during their lifetimes, and later post-polio syndrome and, possibly, chronic fatigue syndrome;
- Humphries ignores the cultural changes in the US – having survived the Great Depression and been victorious in World War II, with many previous diseases eliminated or on the decline, with the miracle of antibiotics, parents found an ascending, unpredictable disease that so visibly affected children to be extremely frightening;
- Humphries opinion of the March of Dimes discounts the major role the March of Dimes played in helping polio victims (help that is doubtful would have come from elsewhere) and, by implication, Humphries probably would dismiss various organizations soliciting funds for numerous other “low incidence” diseases and conditions; and
- Humphries ignores post-polio syndrome and, possibly, chronic fatigue syndrome, where studies have found the former and, perhaps, the latter actually a result of damage caused by the polio virus, not misdiagnosed as polio.
Though I think this paper alone makes a compelling case that Humphries lacks credibility, I like to be thorough, so I will be working on subsequent papers. As now planned:
- Part 2 will focus in more depth on definitions/criteria for paralysis, lab confirmation, when and what types, and differential diagnoses and the role the vaccine played in the decline and disappearance of polio;
- Part 3 will focus on the Cutter Incident, vaccine-associated polio, the role of tonsillectomies and provocation from other medical injections, and claims by Humphries that DDT and arsenic played a significant role, SV40 vaccine contamination, and discuss the Central Dogma that polio resulted from improved sanitation, together with other variables that partially explain the ascendance of polio; and
- Part 4 will focus on treatments, including the iron lung, surgeries, immobilizations, various physical therapies, and nutritional approaches.
Basically, I intend to demonstrate that either Humphries is completely wrong (intentionally or not) about every point she so feebly tries to make or she grossly exaggerates, grossly overgeneralizes, and emphasizes ancient history. Based on her approach she would basically negate most of modern medical science. Stay tuned!
Acknowledgements
For valuable feedback and suggestions, thanks to: Sandi Berman; David W. Rose, MA; Dorit Rubinstein Reiss, PhD; Steven A. Rubin, PhD.