If you were to rely on much of what you see in the mainstream media and on social media, you probably have the impression that we are not doing very well against cancer. Indeed, a common trope I see in a lot of articles is that we are somehow “losing” the war on cancer. Just for yuks, I Googled the term “losing the war on cancer,” and it didn’t take long to find a lot of articles, both in the mainstream press and, more predictably, on alternative medicine-friendly websites making just that argument. Indeed, in 2011, which was the 40th anniversary of President Nixon’s declaration of “war on cancer,” I noted that, so common were articles on that event questioning progress against cancer, I fully expected to be fielding similar articles in 2021 for the 50th anniversary of Nixon’s “war on cancer”; that is, if I’m still blogging then. (I wasn’t blogging in 2001; so I missed the 30th anniversary round of self-flagellation by oncologists.)
To demonstrate what I’m talking about, I picked an article from 2004. The key argument of this sort of article goes something like this:
But it’s not. Hope and optimism, so essential to this fight, have masked some very real systemic problems that have made this complex, elusive, relentless foe even harder to defeat. The result is that while there have been substantial achievements since the crusade began with the National Cancer Act in 1971, we are far from winning the war. So far away, in fact, that it looks like losing.
Just count the bodies on the battlefield. In 2004, cancer will claim some 563,700 of your family, friends, co-workers, and countrymen. More Americans will die of cancer in the next 14 months than have perished in every war the nation has ever fought … combined. Even as research and treatment efforts have intensified over the past three decades and funding has soared dramatically, the annual death toll has risen 73%—over one and a half times as fast as the growth of the U.S. population.
And, six years later in 2010, this:
In 1971, President Nixon and Congress declared war on cancer. Since then, the federal government has spent well over $105 billion on the effort (Kolata 2009b). What have we gained from that huge investment? David Nathan, a well-known professor and administrator, maintains in his book The Cancer Treatment Revolution (2007) that we have made substantial progress. However, he greatly overestimates the potential of the newer so-called “smart drugs.” Researchers Psyrri and De Vita (2008) also claim important progress. However, they cherry-pick the cancers with which there has been some progress and do not discuss the failures. Moreover, they only discuss the last decade rather than a more balanced view of 1950 or 1975 to the present.
I note that this article appeared in Skeptical Inquirer and was written by Reynold Spector, MD. I discussed it in depth before and am merely citing this passage as an example of the sort of argument that I’m talking about. You can read my original deconstruction if you want the details. I also note that what is often forgotten in the media is that cancer is not a single disease, but rather hundreds of diseases, and that it’s rather simplistic to discuss “cancer” as though it were a single disease. Yet we do it all the time.
The reason I decided to address this issue is because it turns out that we aren’t doing as poorly against cancer as commonly portrayed. I was reminded of this by news accounts of a new report that was recently published in the Journal of the National Cancer Institute (JNCI), which reinforced the findings of the 2017 yearly report on cancer published by the American Cancer Society in January, which I had meant to write about but somehow never did. (Now I have my chance to atone for that.) As you will see, together, these reports show slow but steady progress in bringing down the death rates for most cancers. Also, it shows that the overall picture is complicated, such that referring to “losing” or “winning” the war on cancer is a poor way to describe progress on this front.
Cancer mortality: Declining for most cancers
The American Cancer Society (ACS), the Centers for Disease Control and Prevention (CDC), the National Cancer Institute (NCI), and the North American Association of Central Cancer Registries (NAACCR) all collaborate to compile data on cancer incidence and mortality. Periodically, they publish reports on trends in cancer incidence, survival, and mortality in the US. That’s where the primary data for the JNCI report came from, including the National Cancer Institute’s (NCI’s) Surveillance, Epidemiology, and End Results (SEER) Program. The data for the ACS article came primarily from the National Center for Health Statistics and the SEER Program since 1973 and by the Centers for Disease Control and Prevention’s (CDC’s) National Program of Cancer Registries (NPCR) since 1995. Given the overlap in the data sources used, the outcomes examined, and even a couple of the authors, I found it most convenient to use both articles as the basis for my post, noting that, despite the overlap, each study examined somewhat different questions.
Perusing the two studies, I find that the ACS study is a bit more useful because it examines mortality trends over a much longer period of time, whereas the JNCI study emphasizes five year survival more than mortality, and, as I’ve explained before, five year survival rates can be influenced by overdiagnosis and lead time bias, while mortality rates are not. An excellent explanation of lead time bias can be found here (and, if I do say so myself, here), but the basic concept is that if you detect a cancer earlier but your treatments have no effect on the overall biological progress of the cancer, survival will appear to be better even though the patient dies at the same time he would have died of the cancer anyway.
However, the JNCI study notes in the introduction its rationale for examining changes in survival rates:
In addition to death and incidence rates, survival is an important measure for assessing progress in efforts to improve cancer outcomes (19). As with most disease surveillance measures, the interpretation of survival trends is complicated by changes in screening and detection practices (19,20). In particular, screening may lead to the detection of cases that would not have been detected through clinical manifestation in a lifetime (overdiagnosis) or the detection of cancers that are inherently slow growing (length bias). Screening may also result in earlier diagnosis without changing the date of death, generating apparent improvements in survival without changing the actual course of disease (lead time bias) (21). In this report, we examine temporal changes in overall and stage-specific survival for all races/ethnicities combined and in overall survival by race, and contemporary overall survival by race and ethnicity and state of residence. We interpret these survival statistics in the context of changes in screening, early detection, and treatment.
In terms of overall mortality from cancer, the JNCI found that from 2000 to 2014 mortality has been decreasing at 1.8% per year for men and 1.4% per year for women. This is shown in Figure 1 from the paper:
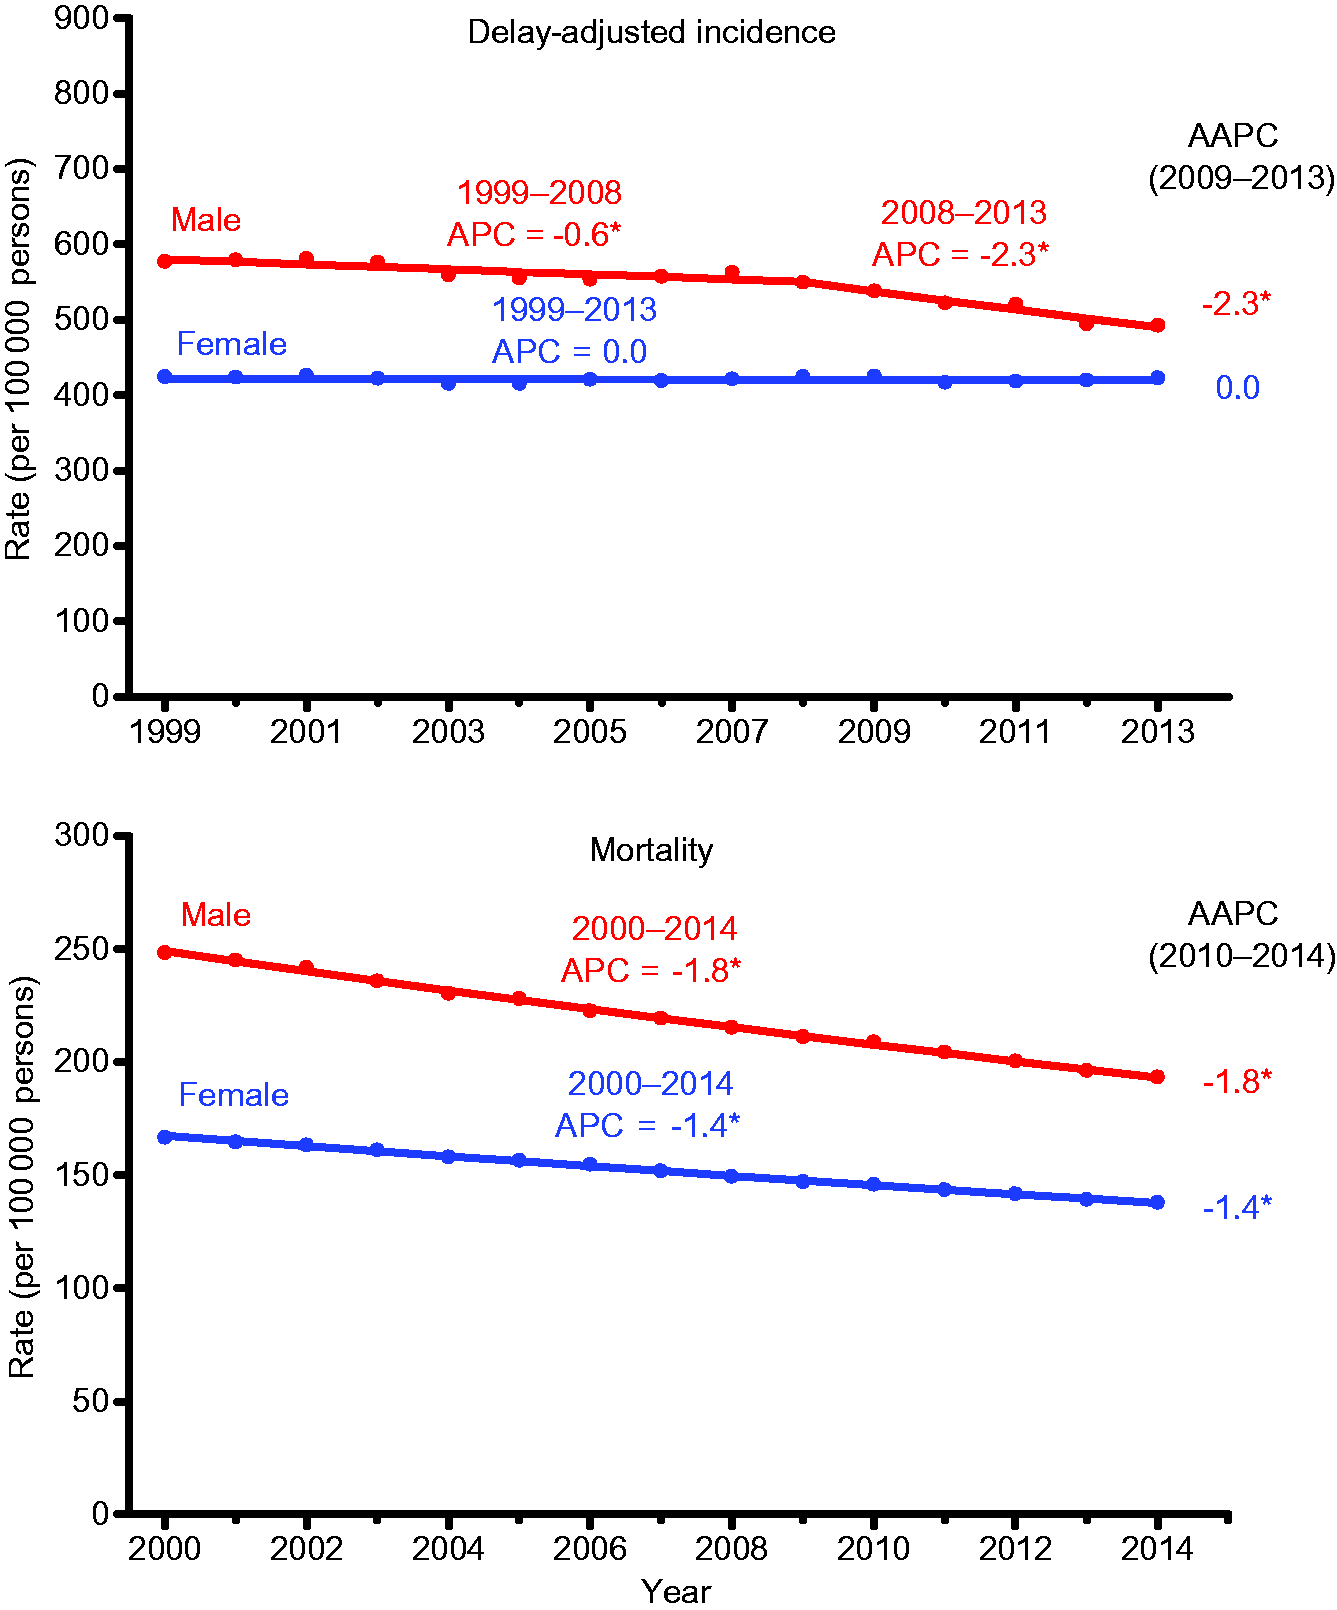
The authors then looked at mortality rates due to various common cancers in men and women and found that mortality has been steadily decreasing for nearly all cancers:
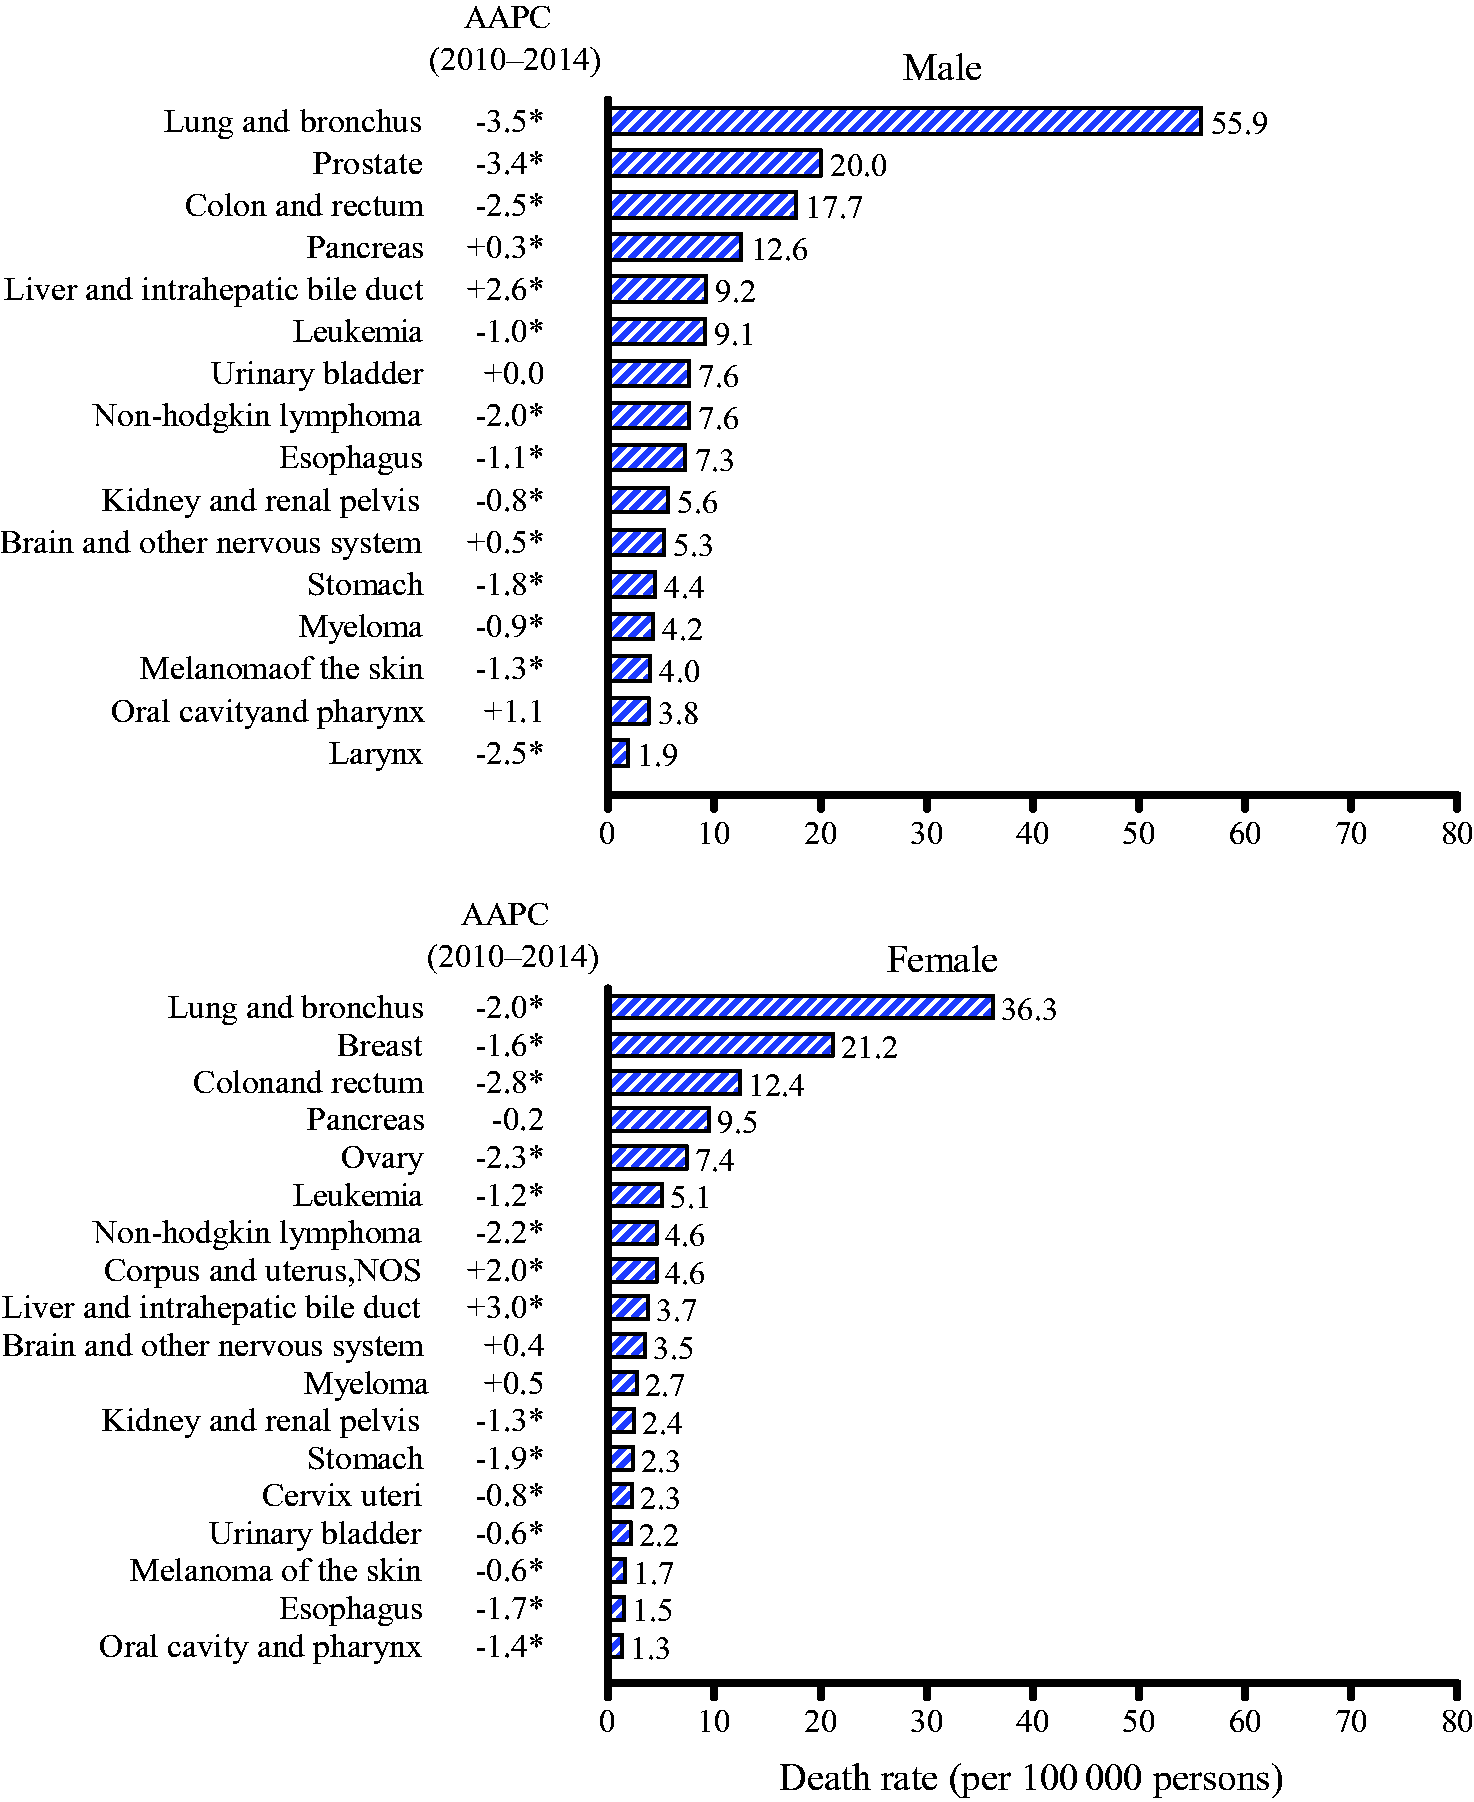
As you can see, death rates during this period decreased significantly for 11 of the 16 cancers in men, with big yearly decreases in lung cancer mortality, attributable mainly to the decline in smoking. In contrast death rates increased for cancers of the liver and, to a lesser extent, of the pancreas and brain, while rates stabilized for bladder and oral cavity cancers. In addition, in women, death rates declined for 13 of the 18 most common cancer types. For example, breast cancer mortality declined by 1.6% per year, consistent with other studies that I’ve seen. The exceptions included cancers of the uterus and of the liver cancer, for which death rates increased, and for pancreas, brain, and myeloma, for which death rates remained stable. By comparison, during the same period, cancer incidence rates among women remained stable, while declining among men.
How do these results compare to the 2017 edition of the ACS yearly study that’s released every January? Well, let’s go to the “money figure,” as I like to call it:
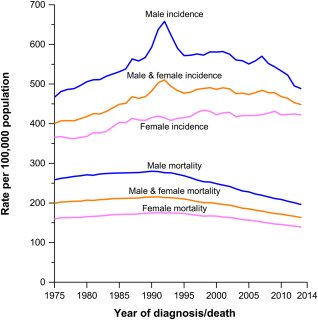
As you can see, its results are consistent with what the JNCI study reports, at least in terms of mortality. Mortality from cancer has been falling steadily since the early 1990s, more in men (who still have higher mortality) than in women. You’ll note that the curves go farther back in time for this graph than they do in the JNCI study. You might also wonder what that peak in male cancer incidence in early 1990s might represent. Wonder no more. Here is the incidence graph, broken down by cancer type:
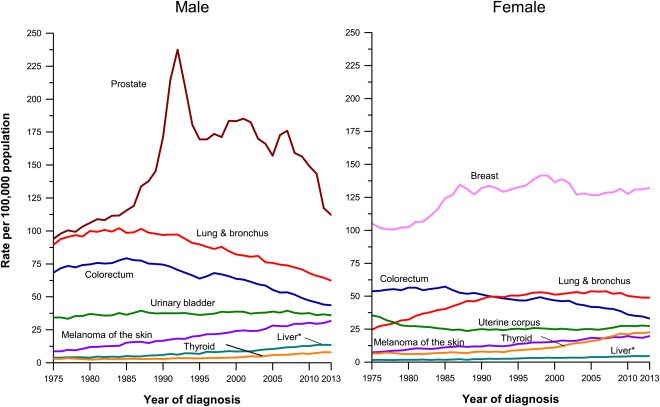
Yes, the increase in cancer incidence that spiked in the early 1990s was due to a surge in the detection of asymptomatic tumors as a result of the introduction of widespread use of the prostate-specific antigen (PSA) test as a screening modality. Notice the further drop after 2010 after the U.S. Preventative Services Task Force (USPSTF) recommended against the routine use of PSA screening because of growing concerns about overdiagnosis and overtreatment of prostate cancer due to the test.
But what about mortality? The ACS answers the question:
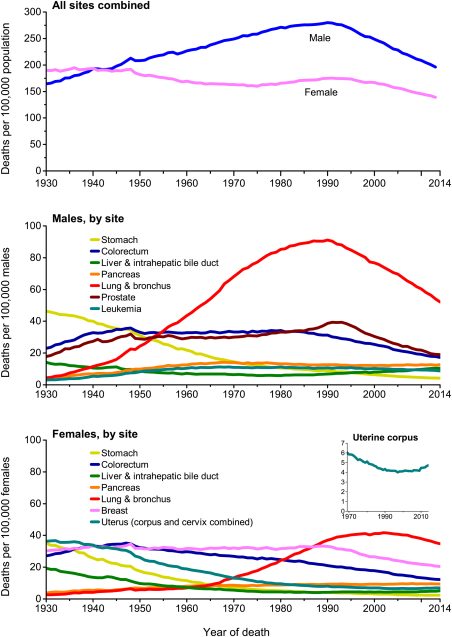
These graphs are informative in that they trace mortality rates all the way back to 1930. If there’s a story to tell here, it’s the story of the orange line, which represents lung cancer, a disease that went from causing few deaths in 1930 to the number one cause of cancer death by the 1950s for men and by the 1990s for women. As you can see, the death rate from lung cancer peaked around 1990 for men and 2000 for women, after which it began a steady decline. All of this is tracks with the prevalence of smoking, with a roughly quarter century delay. It’s also consistent with how men took up smoking in large numbers before women did, hence the 10 year delay between men and women in terms of peak lung cancer mortality.
Not surprisingly, the ACS data also show that the exceptions to the rule of declining mortality are liver cancer and uterine cancer, with little change in the death rate from pancreatic cancer.
What about survival?
I’ve discussed before how cancer mortality is a better measure of success in combatting cancer than five year survival is. The reason, of course, is that five year survival can be affected by screening in terms of overdiagnosis and lead time bias. However, that is not to say that five year and ten year survivals are not useful measures of progress against cancer. Five year survival rates for cancers which we don’t routinely screen, for instance, are far less likely to be affected by such factors. As I noted before, the cancers for which the US has better five year survival rates than European countries are virtually all cancers for which the U.S. screens intensively, such as prostate and breast cancer. Also examining stage-specific survival rates can help mitigate the likelihood that lead time bias is the explanation for an increase in five year survival rather than an actual improvement in treatment.
In the JNCI paper, changes in five year survival were compared between the periods of 1975-1977 and 2006-2012, both for all stages lumped together and among cancers diagnosed as local disease, regional disease, and distant metastasis (spread). The all-stage data were reported in the paper and the data broken out by stage were reported in a very unwieldy table in the supplemental material. Over that time, changes in five year survival for various cancers overall ranges from a relative change of -4% (absolute percentage: -3.5%) for uterine cancer to 428% (absolute percentage 14.6% or from 3.4 to 18.1%) for cancer of the liver and intrahepatic bile ducts. In other words, even though five year survival for liver cancer has gone from utterly dismal to just dismal in 40+ years, more people are dying of liver cancer because its incidence is increasing. In any event, five year survival has indeed increased for breast and prostate cancer, as we would expect for screen-detected cancers subject to the potential overdiagnosis, but the five year survivals for a number of cancers for which we do not screen have increased markedly, such as: non-Hodgkin’s lymphoma (from 46.5% to 72.6%); melanoma (from 81.9% to 93.2%); leukemia (from 34.2% to 62.7%); and multiple myeloma (from 24.6% to 50.2%). For all sites, adjusted by case mix, five year survival has increased from 50.3% to 66.4%.
For more advanced disease, it’s not surprising that increases in survival have been less impressive but real. For instance, for metastatic breast cancer, five year survival has increased from 18.7% in 1977 to 33.6% in 2012, which is nearly a doubling in survival. Gains have been even more impressive in head and neck cancer, with an increase from 18.5% five year survival to 39.8%. Unfortunately, some of these doublings in five year survival are not so great in absolute terms. For instance, in lung cancer, five year survival for metastatic lung cancer has more than doubled, but that represents going from 1.8% to 4.2%, a result that no one would consider a major advance, particularly patients and their families. Ditto metastatic pancreatic cancer, for which survival has only increased from 0.9% to 3.3%. The problem, of course, is that even though survival for localized pancreatic cancer has increased from 7% to 32.1%, the vast majority of pancreatic cancer is not found when it’s still localized to the organ.
Finally, there remain some real disparities in cancer outcomes based on race and region. For example, this figure compares five year survival statistics for Caucasians versus African-Americans for localized, regional, and metastatic cancers:
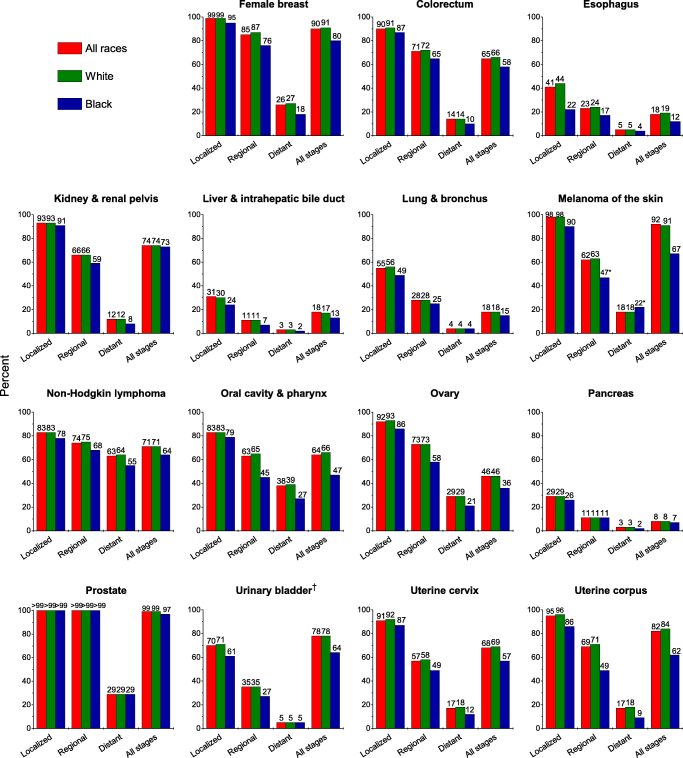
As you can see, African-Americans with nearly every cancer do significantly worse, particularly for localized and regional cancers, where treatment makes the most difference. Unfortunately, not everyone is sharing equally in the improvements in survival and declines in mortality due to cancer.
Are we winning or losing the war on cancer?
So we circle back to the original question that inspired this post: Are we winning or losing the war on cancer? I know, I know, it’s a simplistic question, and I myself pointed out how cancer is not one disease near the beginning of this exploration. I also routinely point out the same thing whenever someone asks the question, “Why haven’t we cured cancer yet?” (Mainly because it’s complicated as hell.) What the evidence shows clearly is that death rates from cancer are slowly falling, driven by declines in death rates from most of the common cancers. Meanwhile, five year survival rates are climbing for most cancers, even for more advanced disease. Unfortunately, the answer to my question is, like many Facebook relationship statuses, complicated.
Any strategy to combat cancer rests on three legs: Prevention, diagnosis, and treatment. Changes in diagnostic modalities can increase the apparent incidence of cancer through overdiagnosis, as well as the five year survival through lead-time bias, but they can also result in a decrease in mortality due to the cancer being screened for. There are many tradeoffs.
There is also little doubt that improvements in treatment have likely played a significant role in the declines in mortality from some cancers and improved five year survivals. Some of this can be seemingly mundane, even though it really isn’t, such as improvements in surgery. Indeed, the authors also note that, for cancers for which the primary treatment is surgery that has a significant mortality rate, such as cancers of the stomach, lung, pancreas, and esophagus, decreasing the acute mortality from surgery will improve the five year survival. Indeed, they note that lower surgical mortality may have been achieved through improvements in anesthesia and supportive care, institution of quality improvement programs, and regionalization of high-risk surgeries. Again, it’s complicated.
Improvements in chemotherapy, targeted therapy, and other treatments also likely played a role in the declines in cancer mortality:
The survival improvements over time highlighted in this report also reflect major advances in systemic therapies for some cancers, including imatinib mesylate for chronic myelogenous leukemia in the early 1990s (79), rituximab for B-cell non-Hodgkin lymphoma in the 1990s (80), and combination of chemotherapies for childhood cancers beginning in the 1960s (81,82). In particular, the continued statistically significant improvements in five-year survival rates for most cancers occurring in children—with over 80% of children surviving five years during recent diagnosis years—have been attributed to the systematic conduct of clinical trials assessing the efficacy of multimodal approaches involving combination chemotherapy, radiotherapy, and/or surgery with increased expertise in supportive care in specialized cancer centers (83). Member institutions of the Children’s Oncology Group, a National Cancer Institute supported trials group, care for 90% of children diagnosed with cancer in the United States (61,84).
In this era of increasingly personalized cancer therapy, it is hoped that dramatic progress in treatment and survival will be observed for other cancer types as well. It may not be possible in this analysis to detect the impact of very recent therapeutic improvements on population survival due to the time lag for case reporting and follow-up in cancer registry data; examples include protein kinase inhibitors for non–small cell lung cancer, colorectal cancer, and chronic myeloid leukemia; anti-angiogenics (which inhibit blood vessel growth) for colorectal and ovarian cancers; and immunotherapy for melanoma and non–small cell lung cancer (85). Such improvements may also be difficult to discern in population-based registry data for therapies that apply only to subsets of patients for a cancer site.
However, as good as our tests and treatments can be, we can’t forget that tobacco remains the single largest cause of preventable cancer in existence, and the main cancer it causes, lung cancer, is among the most deadly. As noted in the ACS paper from January:
The decline in cancer mortality over the past 2 decades is the result of steady reductions in smoking and advances in early detection and treatment, reflected in considerable decreases for the 4 major cancers (lung, breast, prostate, and colorectum) (Fig. 7). Specifically, the death rate dropped 38% from 1989 to 2014 for female breast cancer, 51% from 1993 to 2014 for prostate cancer, and 51% from 1976 to 2014 for colorectal cancer. Lung cancer death rates declined 43% from 1990 to 2014 among males and 17% from 2002 to 2014 among females due to reduced tobacco use because of increased awareness of the health hazards of smoking and the implementation of comprehensive tobacco control.[41] Tobacco control efforts adopted in the wake of the first Surgeon General’s report on smoking and health in 1964 have resulted in an estimated 8 million fewer premature smoking-related deaths, one-third of which are due to cancer.[42, 43] Despite this progress, in much of the Southern United States, 40% of cancer deaths in men in 2014 were caused by smoking.[44]
The JNCI paper agrees and notes:
In particular, cigarette smoking prevalence among adults over the past 50 years decreased by more than 50% because of public health policies against tobacco and increased awareness about the health hazards of smoking (42). However, there are still about 40 million adult smokers (43), and smoking remains the leading cause of cancer death (42,44–46). These facts underscore the need for expansions of federal and state tobacco control programs and the development of new strategies, such as pricing strategies and plain tobacco packaging to accelerate the reduction in tobacco use (47).
Indeed, a significant fraction of the overall decrease in cancer mortality is being driven by declines in lung cancer mortality due to the decline in smoking over the last 50 years. However, it’s not all just smoking. I note that breast cancer is a cancer whose incidence is not strongly influenced by smoking history, but mortality from this cancer has declined over 30% since 1990. Mortality from several other cancers is declining at similar rates. It would seem that we are slowly winning the war on cancer, but, again, it’s complicated, and there are warning flags on the horizon.
One such warning flag is the obesity epidemic. My cancer center recently hosted Otis Brawley, the medical director of the American Cancer Society. He noted that, as smoking-related cancers are in decline due to the decline in smoking, obesity-related cancers are on the rise, thanks to the huge increases in obesity since the 1980s. Indeed, the obesity epidemic is likely responsible in part for the increase in mortality from liver cancer:
In contrast, the continued increase in liver cancer incidence rates is likely due to the high prevalence of chronic hepatitis C virus infection resulting from intravenous drug use by baby boomers during the 1960s to 1980s, as well as the obesity epidemic beginning in the 1980s (18). The obesity epidemic also may have contributed in part to the increases in endometrial, pancreas, and kidney cancer incidence rates (14) because obesity is estimated to account for 49%, 28%, and 24% of the total cases, respectively, in the United States (57).
Indeed, the obesity epidemic has yet to show its full effects on cancer incidence and mortality, given that obesity has been linked to at least 13 types of cancer, including a very strong association with uterine cancer and adenocarcinoma of the esophagus and a significant association with liver, pancreas, and gastric cancer. Dr. Brawley noted that it likely won’t be long before obesity-associated cancers surpass tobacco-associated cancers as the main causes of preventable cancer mortality. Again, it’s complicated, and that’s without even going more deeply into the disparities in cancer incidence and survival based on race and region. Cancer is multifactorial.
So, are we winning or losing the war on cancer? I would argue that, contrary to the common perception, we are not losing it. Mortality is declining and survival is increasing for most cancers. It’s just that progress is slow. It might have been hubris to think that progress would be anything other than slow, or it might have been overpromising in order to secure research funding. It was probably both. Whatever the case, conquering all cancers is a project that will take more than decades. It will take generations.