
I’ve lost track of the number of times that I’ve written this in the three years since a novel coronavirus causing a deadly respiratory disease that came to be named COVID-19 started spreading from Asia to Europe and the rest of the world. Unfortunately, however, yet another opportunity has arisen to say it again. In the world of antivaccine misinformation, disinformation, conspiracy theories, and pseudoscience, everything old is new again. Antivaccine misinformation that I first encountered a decade—or even two decades!—ago has been reborn and repurposed to attack COVID-19 vaccines, while the fear of COVID-19 vaccines has led previously COVID-19 vaccine-only antivaxxers to embrace all manner of old antivaccine misinformation about vaccines other than COVID-19 vaccines. It’s an amplification loop in which old techniques of demonizing vaccines applied to COVID-19 that seem new because no one other than antivaxxers and those of us who were paying attention to antivaxxers before the pandemic had encountered it metastasize back to affect all childhood vaccines again, thus fomenting a more general vaccine hesitancy for all vaccines, even among people who would have considered themselves “pro-vaccine” before the pandemic. In brief, “new school” COVID-19 antivaxxers are increasingly becoming indistinguishable from “old school” antivaxxers. That’s why it should be no surprise that antivaxxers are taking full advantage in order to use COVID-19 vaccine mandates to attack all vaccine mandates, including school mandates. Antivaxxers are also using distrust of COVID-19 vaccines to promote general distrust of all vaccines, especially childhood vaccines
So it was with a combination of alarm and amusement that I came across an article on Robert F. Kennedy, Jr.’s antivaccine website Children’s Health Defense entitled Higher Infant Mortality Rates Linked to Higher Number of Vaccine Doses, New Study Confirms. One of the advantages of having been studying antivaccine misinformation, pseudoscience, and conspiracy theories is that the headline itself made me think that I knew what this was and who was behind this “study.” It turns out that my suspicions were correct.
Everything old is new again: Prelude
First, here’s how RFK Jr.’s minion Michael Nevradakis spins it in his story:
A new peer-reviewed study found a positive statistical correlation between infant mortality rates (IMRs) and the number of vaccine doses received by babies — confirming findings made by the same researchers a decade ago.
In “Reaffirming a Positive Correlation Between Number of Vaccine Doses and Infant Mortality Rates: A Response to Critics,” published Feb. 2 in Cureus, authors Gary S. Goldman, Ph.D., an independent computer scientist, and Neil Z. Miller, a medical researcher, examined this potential correlation.
Their findings indicate a “positive correlation between the number of vaccine doses and IMRs is detectable in the most highly developed nations.”
The authors replicated the results of a 2011 statistical analysis they conducted, and refuted the results of a recent paper that questioned those findings.
Bingo. My suspicion was correct. This was the study, published in a journal that many of you might recognize, Human & Experimental Toxicology, which has been a font of bad antivax studies dating back years and years, entitled Infant mortality rates regressed against number of vaccine doses routinely given: Is there a biochemical or synergistic toxicity? And guess what? I deconstructed how awful that study was in 2011, shortly after it had been published. Regular readers know that I can rarely pass up a chance to revisit old disinformation resurrected and tarted up by antivaxxers to frighten people about vaccines yet again, and so as soon as I knew that this was Goldman and Miller resurrected I knew I had to write about this again because I had seen it bubbling up on social media, thanks to RFK Jr., for example:
I included that response, because it’s been a longstanding antivax trope that vaccines cause sudden infant death syndrome (SIDS). They don’t.
Another example:
No, and worse: https://t.co/pymfQ6t0oO
— Not so fast (@zegaracr) February 11, 2023
Of course, one question that immediately occurred to me was: Why now? Why is this old antivax message that vaccines kill babies popping up again now? I think this is the answer:
I’ve seen rants about this all over Twitter last week. Although Goldman and Miller likely couldn’t have known that the CDC might add COVID-19 vaccines to the recommended routine childhood vaccination schedule now, they could have been looking for another opportunity to promote their message. On the other hand, I looked at the journal website for Cureus, which is the journal where Goldman and Miller published their “new” study on vaccines and childhood mortality rates, and saw that the journal touts its average time to first decision as 1.7 days and its time to first publication as 37 days. These are pretty fast. This journal has also published some very dodgy work on ivermectin touting it as highly effective prophylaxis against COVID-19. (It’s not, as I discussed.)
So let’s compare Goldman and Miller in 2011 to Goldman and Miller in 2023. Here’s RFK Jr.’s minion Nevradakis again:
In 2011, Miller and Goldman published a peer-reviewed study in Human and Experimental Toxicology, which first identified a positive statistical correlation between IMRs and number of vaccine doses.
The researchers wrote:
“The infant mortality rate (IMR) is one of the most important indicators of the socio-economic well-being and public health conditions of a country. The U.S. childhood immunization schedule specifies 26 vaccine doses for infants aged less than 1 year — the most in the world — yet 33 nations have lower IMRs.
“Using linear regression, the immunization schedules of these 34 nations were examined and a correlation coefficient of r = 0.70 (p < 0.0001) was found between IMRs and the number of vaccine doses routinely given to infants.”
In the above figures, “r” refers to the correlation coefficient, a number that ranges from -1 to 1. Any figure above zero is understood as a positive correlation, with figures between 0.6 and 0.79 considered a “strong” positive correlation, and 0.8 and above a “very strong” positive correlation.
The “p-value” indicates the extent to which the predictor’s value, in a linear regression analysis, is related to changes in the response variable.
A p-value of 0.05 or below is considered statistically significant, and indicative that the predictor and the response variable are related to each other and move in the same direction.
In the same 2011 study, which used 2009 data, the researchers found that developed nations administering the most vaccine doses to infants (21 to 26 doses) tended to have the worst IMRs.
I can hear epidemiologists and statisticians facepalming in unison at the very concept of doing a linear regression between vaccine doses in the childhood vaccine schedule of different nations and infant mortality rates (IMRs) in those countries. That’s before you even consider how completely arbitrary and riddled with errors the method used to estimate the number of “vaccines” in each nation’s recommended schedule was, as I’ll quote and recap from 12 years ago:
Arbitrary: they count number of vaccines in US bins (DTaP is one, hib is separate) and non-specific designations (some “polio” is still given as OPV in Singapore), rather than antigens. If they did that, Japan, still giving the live bacterial vaccine BCG, would immediately go to the top of the list. That wouldn’t fit the agenda, of course. But if you go by “shot” rather than by antigen, why are DTaP, IPV, hepB and hib counted as 4 shots for example in Austria, when they are given as Infanrix hexa, in one syringe?
Mistakes: The German childhood vaccination schedule recommends DTaP, hib, IPV AND hepB, as well as PCV at 2, 3 and 4 months, putting them squarely into the 21 – 23 bin. The fourth round of shots is recommended at 11 to 14 months, and MenC, MMR and Varicella are recommended with a lower age limit of 11 months, too, which means that a number of German kids will fall into the highest bin, at least as long as you count the Miller/Goldman way.
Then, they neatly put those arbitrarily counted doses into bins. Binning (i.e. grouping numbers before correlating them to something) always makes me suspicious. I don’t have the time to check each country’s vaccination schedule – I assume there will be mistakes in many claims, but I am guessing that if we plotted the infant mortality against the actual number of recommended vaccines, the correlation would be less good than engineered in this paper, i.e. the dose count above is probably not all that “arbitrary”.
In brief, Goldman and Miller arbitrarily—but really, not quite so arbitrarily—defined multivalent vaccines into multiple vaccine doses as it suited them to promote their message, used a method that epidemiologists would laugh at given that it is the ecological fallacy on steroids, and then didn’t even try to control for confounding factors, of which there were many. Also, did I mention that they cherry picked only 34 countries and then removed four nations, Andorra, Liechenstein, Monaco, and San Marino, the justification being that because they are all so small, each nation only recorded less than five infant deaths? (One wonders whether including them would have made the “correlation” less striking.) Or that, more dubiously, for some reason the authors, not content with an weak and not particularly convincing linear relationship in the raw data, decided to do a little creative data manipulation and divide the nations into five groups based on number of vaccine doses, take the means of each of these groups, and then regraph the data? Not surprisingly, the data look a lot cleaner, which was no doubt why this was done, as it was a completely extraneous analysis.
Then, as I noted then, it’s very dicey to compare IMRs across nations because different countries define an infant mortality, differently, and I cited an article describing why that is no longer available even on the Wayback Machine at Archive.org and will quote this passage again:
First, it’s shaky ground to compare U.S. infant mortality with reports from other countries. The United States counts all births as live if they show any sign of life, regardless of prematurity or size. This includes what many other countries report as stillbirths. In Austria and Germany, fetal weight must be at least 500 grams (1 pound) to count as a live birth; in other parts of Europe, such as Switzerland, the fetus must be at least 30 centimeters (12 inches) long. In Belgium and France, births at less than 26 weeks of pregnancy are registered as lifeless. And some countries don’t reliably register babies who die within the first 24 hours of birth. Thus, the United States is sure to report higher infant mortality rates. For this very reason, the Organization for Economic Cooperation and Development, which collects the European numbers, warns of head-to-head comparisons by country.
Infant mortality in developed countries is not about healthy babies dying of treatable conditions as in the past. Most of the infants we lose today are born critically ill, and 40 percent die within the first day of life. The major causes are low birth weight and prematurity, and congenital malformations. As Nicholas Eberstadt, a scholar at the American Enterprise Institute, points out, Norway, which has one of the lowest infant mortality rates, shows no better infant survival than the United States when you factor in weight at birth.
I will also cite this one that explains why US IMR appears so high compared to other countries. (Hint: It has nothing to do with the number of vaccines in the childhood vaccination schedule.)
Fast forward 12 years.
Everything old is new again: 2023 Goldman and Miller edition
As the adage goes, when your only tool is a hammer, everything starts looking like nails, and I can’t think of a better example to which to apply this adage than Goldman and Miller. Basically, in this new paper, they double down on their previous linear regressions and then try to do additional questionable analyses to support their previous analysis. Also, I get the feeling from their introduction that they’re really, really cheesed at a preprint published in 2021 and updated through 2022 that debunked their 2011 “study.” To be honest, I was puzzled when I learned of this article, mainly because I wondered why anyone would bother in 2021 (when the first version was posted to a preprint server) to rehash a 2011 antivax paper. Helpfully, the authors of the preprint, Nysetvold et al, explain:
Although the 2011 study was published in a peer-reviewed journal (Human and Experimental Toxicology), a brief reading of the Miller and Goldman manuscript led us to question the methods, results and conclusions. We observed significant deficiency in the statistical methods. Thus, it is troublesome that this manuscript is in the top 5% of all research outputs since its publication, being shared extensively on social media with tens of thousands of likes and re-shares (see https://acs.altmetric.com/details/406556).
My fault is that I hadn’t realized that this paper had been so widely shared and cited in the last 12 years; I should have. I basically debunked the paper as ridiculous and then moved on to the many, many other bad antivax studies being published. First, though, let’s look at the preprint’s conclusions. Being actual scientists, the team led by Elizabeth Bailey at Brigham Young University found, using the same data used by Goldman and Miller, plus data for all 185 nations, the following:
We show that the sub-sample of 30 countries used in the original paper was an unlikely random sample from the entire dataset, as the correlation coefficient of 0.49 reported in that study would only arise about 1 in 100,000 times from random sampling. If we investigate only countries with high or very high development, human development index explains the variability in IMR, and vaccine dose number does not. Next, we show IMR as a function of countries’ actual vaccination rates, rather than vaccination schedule, and show a strong negative correlation between vaccination rates and IMR. Finally, we analyze United States IMR data as a function of Hepatitis B vaccination rate to show an example of increased vaccination rates corresponding with reduced infant death over time. From our analyses, it is clear that vaccination does not predict higher IMR as previously reported.
Quelle surprise. Goldman and Miller’s findings were easily explained by actual scientists as arising primarily from a nonrandom selection of nations, not looking at actual vaccination rates rather than the suggested vaccine schedule, and the human development index of the nations examined as a major confounder. That reminds me that I should have really pointed out before now that it is a fallacy to compare just the vaccine schedule to IMRs because just because a vaccine is on the schedule doesn’t mean that children are getting those vaccines, given the variation in resources and health care availability between nations—and even within nations. Another thing that I should have questioned is the very assumption that any correlation between the number of vaccine doses and IMRs must be linear. There is no a priori reason to assume that, which makes Miller and Goldman’s insistence on doing linear regression after linear regression dubious to begin with. Indeed, Bailey’s group notes this:
We checked the assumptions of linear regression for each regression analysis (results in each respective figure or table folder, see also README.md file in github repository for details). For all analyses except rotavirus in Figure 3, the assumption of homoscedasticity was violated. Thus, we used the vcovHC function from the sandwich package in R to generate heteroscedasticity robust standard errors for our hypothesis testing (36). Otherwise, all assumptions of linear regression were met.
Homoscedasticity is defined thusly:
The assumption of homoscedasticity (meaning “same variance”) is central to linear regression models. Homoscedasticity describes a situation in which the error term (that is, the “noise” or random disturbance in the relationship between the independent variables and the dependent variable) is the same across all values of the independent variables. Heteroscedasticity (the violation of homoscedasticity) is present when the size of the error term differs across values of an independent variable. The impact of violating the assumption of homoscedasticity is a matter of degree, increasing as heteroscedasticity increases.
None of this should be surprising given how different the data sources being compared are. So I am going to fast-forward to Goldman and Miller’s discussion, where they state:
The Bailey reanalysis contains heteroscedastic data. Due to the dissimilar values of IMR over the range of the number of vaccine doses, Bailey’s data do not have a constant variance (homoscedasticity). This leads to less precise coefficient estimates, and statistical tests of significance are invalidated.
What Goldman and Miller fail to mention is that Bailey’s team did an appropriate mathematical calculation in order to be able to examine heteroscedastic data. They just make it sound as though Bailey just ignorantly plugged heteroscedastic data into their linear regression without further analysis, not unlike the way they did in their first paper. (Projection is epic among antivaxxers.)
In fact, Goldman and Miller give the game away in their introduction when they worry that Bailey and her team “appear to be targeting our study for a potential retraction.” My first reaction to this lament is, “Gee, you say that as though it were a bad thing.” After all, Goldman and Miller’s study should never have been published in a peer-reviewed journal; indeed, it should have been retracted a decade ago. However, the journal in which it was published has long been a haven for poorly designed and executed antivaccine studies; so getting its editors to retract anything is not particularly likely.
A particularly telling part of Goldman and Miller’s paper is its complaint that Bailey’s group looked at 185 countries and therefore included outliers. What they ignore is that Bailey’s group looked at all of those groups not just to test to see if the Miller/Goldman “analysis” would hold up for a much larger sample of countries, but to test how likely their result would be using a truly random subset of the 185 nations:
In order to better visualize how extreme Miller and Goldman’s result was even within their own dataset, we randomly sampled 30 countries from the full dataset of 185 countries and computed the linear regression. This sampling was done 50,000 times, and the distribution of regression results was plotted (Figure 2). We then determined the degree to which Miller and Goldman’s result (R2 = 0.493) may be considered an outlier. Within this distribution of random samples, the mean R2 was 0.049 with a standard deviation of 0.053. We calculated the z-score of 0.493 against our distribution to be 8.3, meaning there is approximately a 1 in a 100,000 chance that this result was achieved with a random sample of the dataset. To verify this, we performed 1 million random samplings, and the most extreme R2 observed was 0.577, with only 10 samples’ R2 exceeding 0.493. Therefore, we conclude that the sample of 30 countries from the Miller and Goldman analysis is not representative of the full dataset.
The bottom line? Goldman and Miller did indeed cherry pick the countries they examined.
So what about the new “analysis” by Goldman and Miller? Well, including 185 countries doesn’t yield much of a better result:
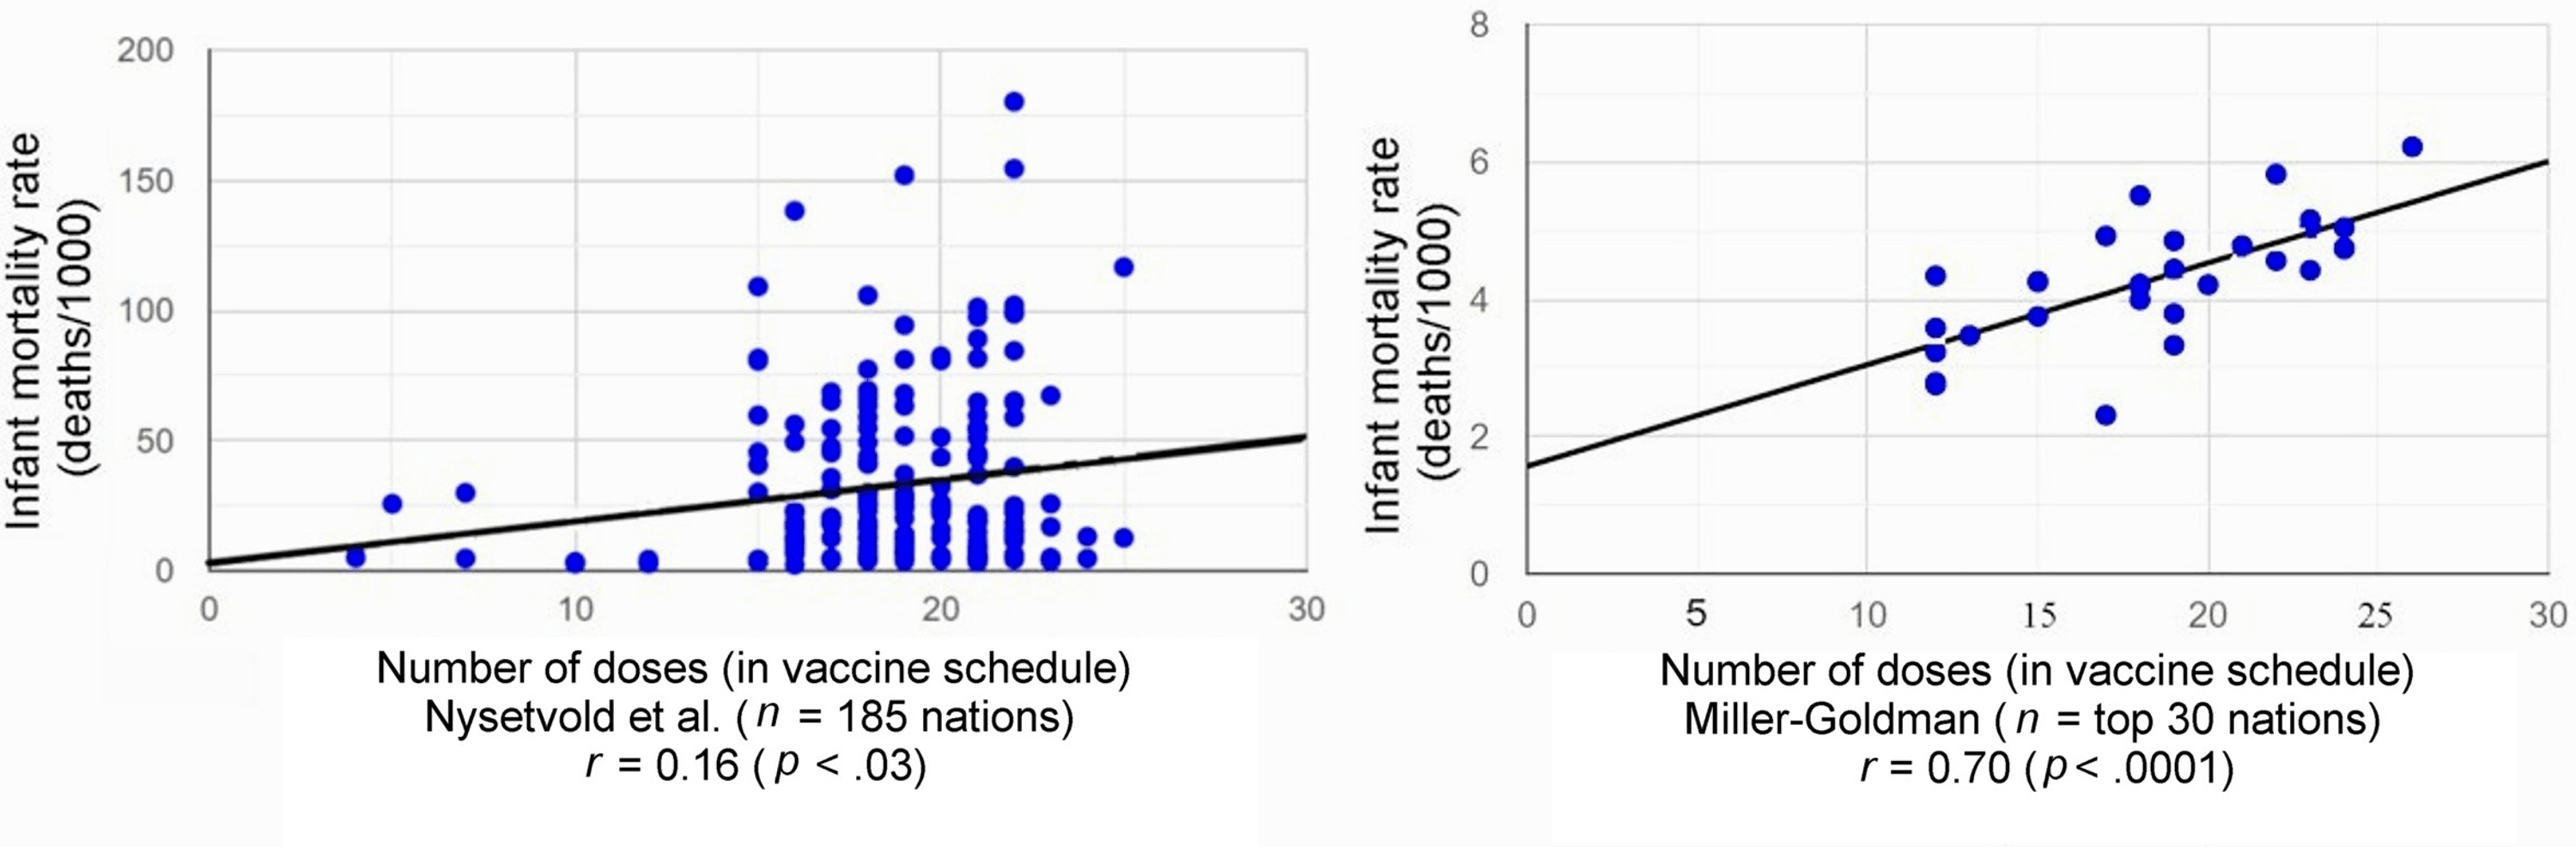
This is what we in the biz call a “star chart.” Notice how the points removed from the graph on the left are all mainly the ones clustered around very low infant mortality rates.
Basically, this is what we in the biz call a “star chart.” For one thing, an r=0.16 is basically no significant correlation. In fact, r2 (which is what we are really interested in) would be 0.0256. So basically, even taking Goldman and Miller’s result at face value, vaccine dose number would only explain 2.6% of the variance in the model using all 185 nations, and they couldn’t let that result stand, as even they appear to sense that what they are showing is basically noise, particularly when you consider the lack of control for confounders. Sure, there’s a p-value that is (barely) under 0.05, but this is still basically an r-value that is indistinguishable from zero or so small as to be clinically meaningless, either at a population level or at an individual level. Indeed, if I ever found a correlation coefficient that low in a proposed linear regression model, I’d either conclude that there is no linear relationship between the variables or start looking for more complex models. In this case, I’d conclude the former.
Miller and Goldman appear to recognize this, at least implicitly, as they start slicing and dicing the dataset to try to find more—shall we say?—convincing r-values. Interestingly, to this scientist at least, they do the exact opposite. Their sensitivity analysis, in which they add more countries to their original 30 nations from their 2011 paper shows something very telling:
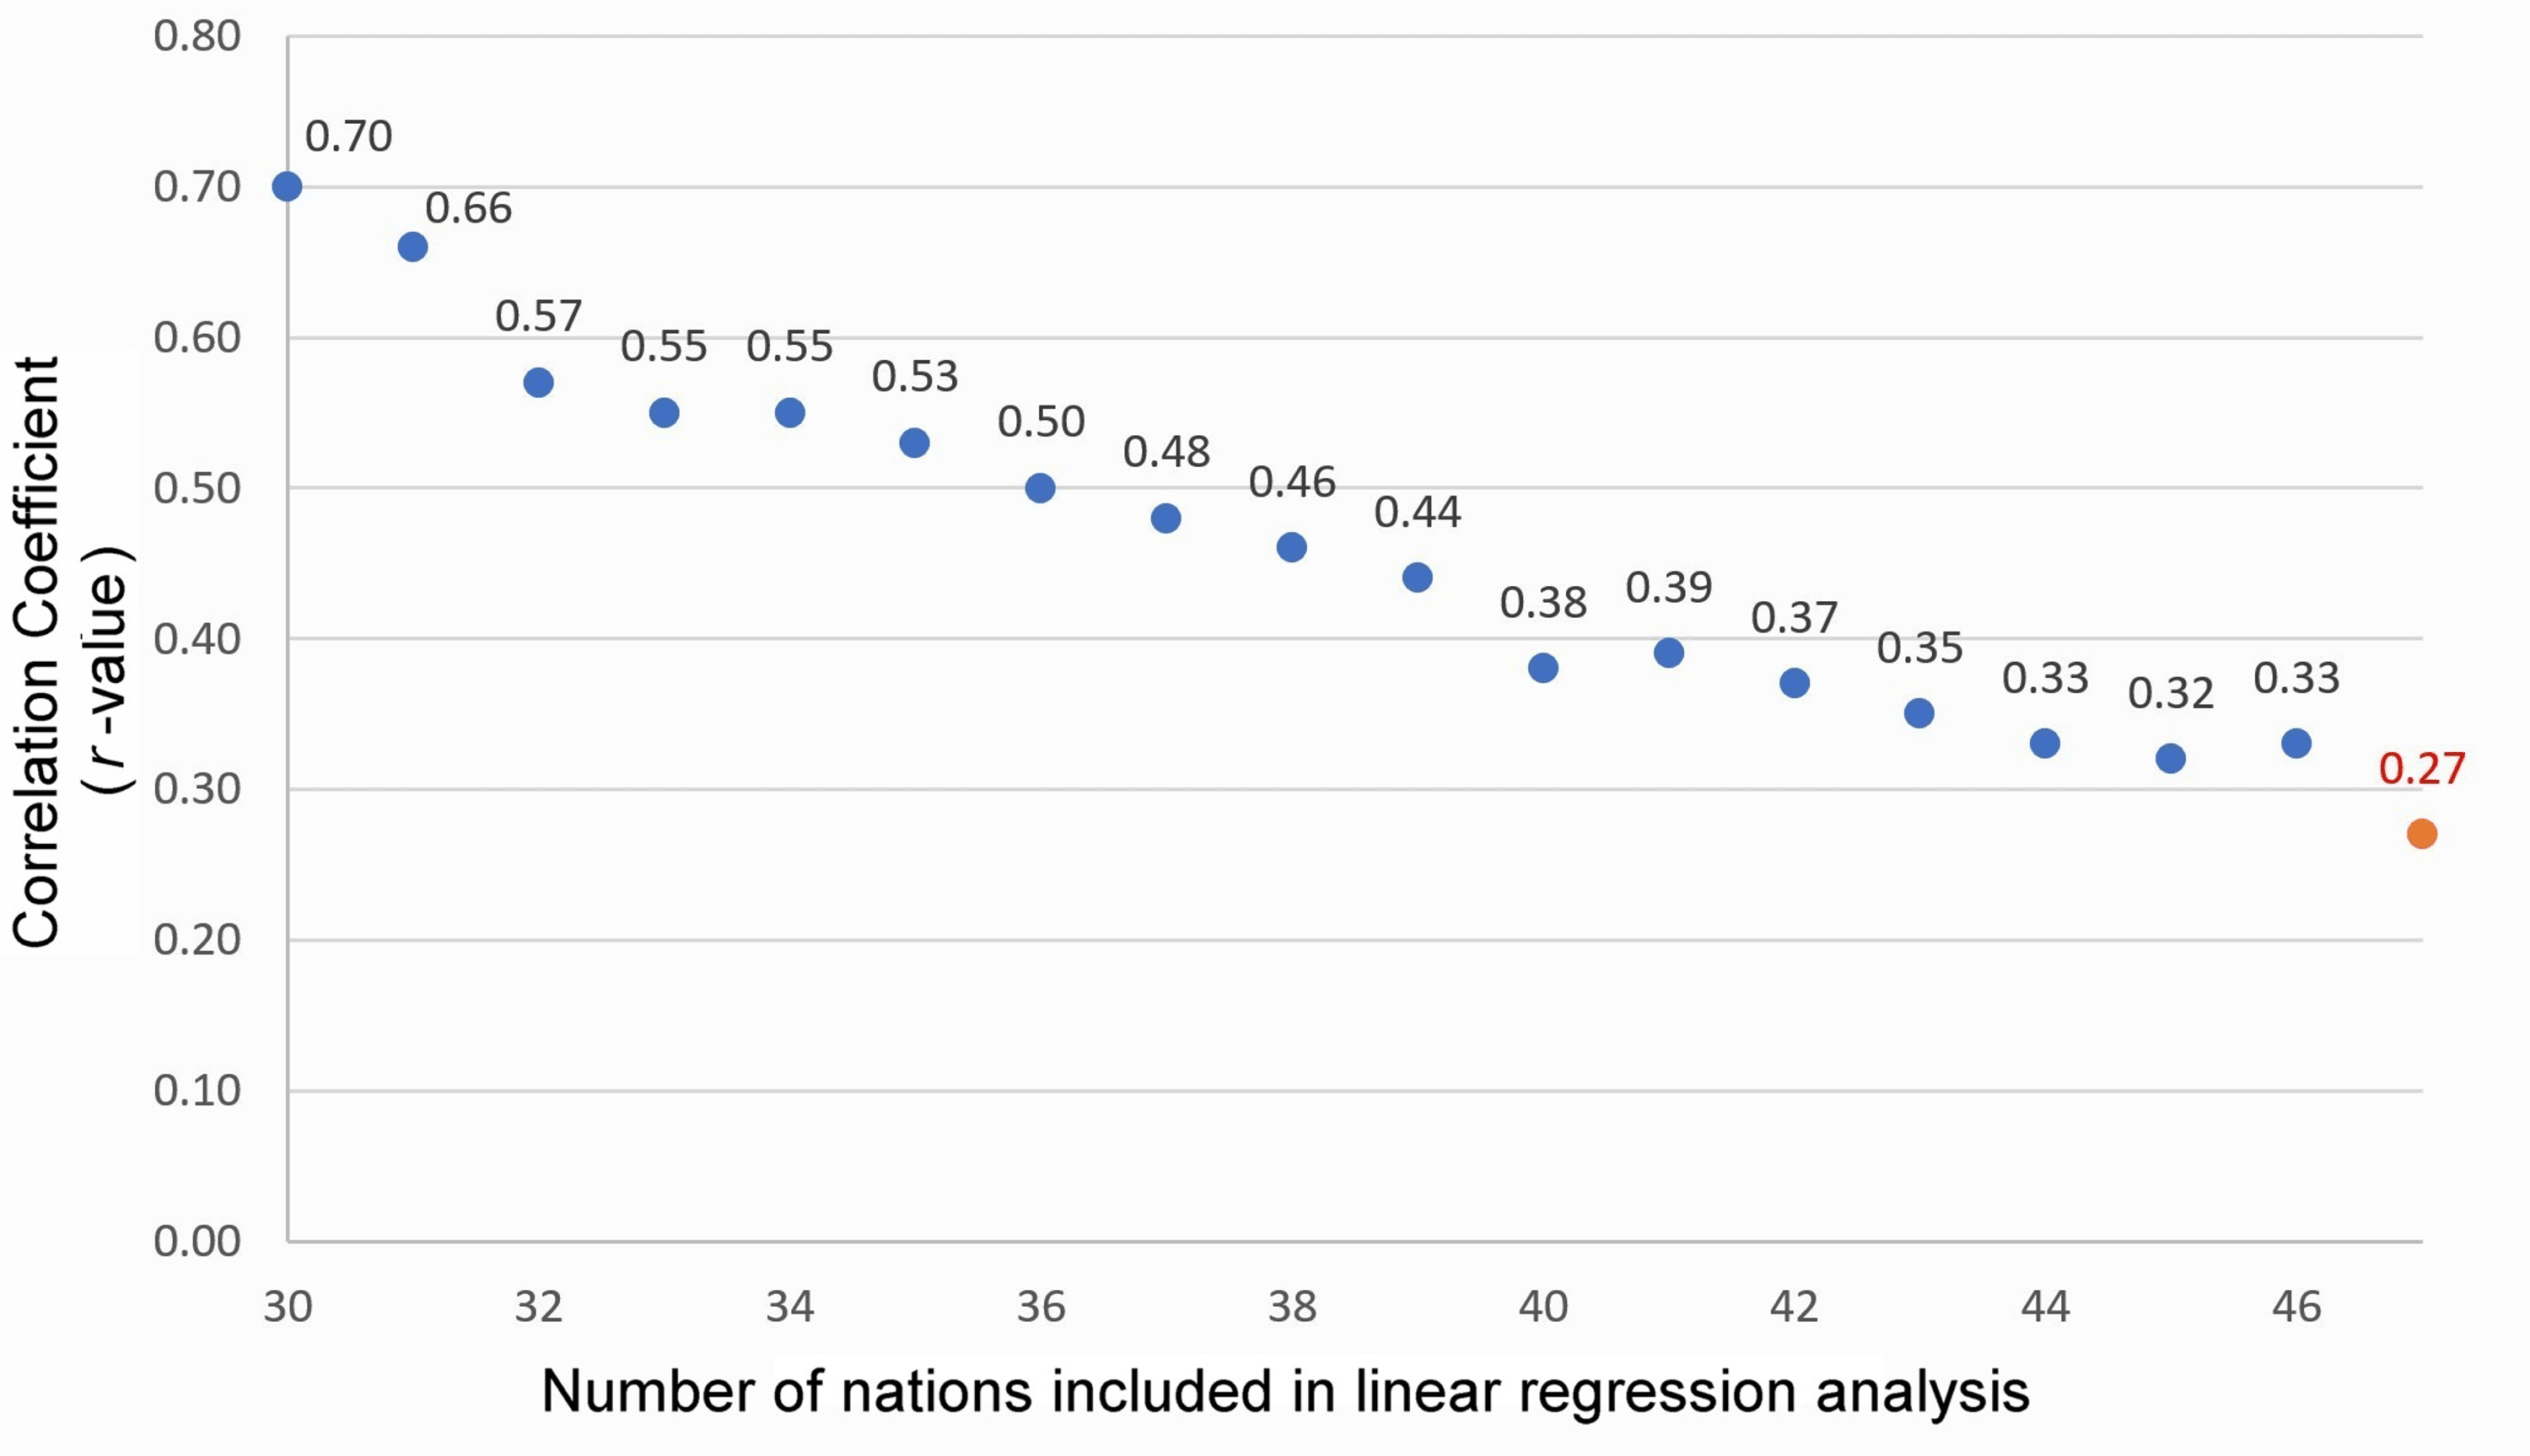
This is a case where a graph doesn’t show what the authors think it does. Also, even if r=0.70, that would mean r2=0.49, which is not a high number for the variance attributable to the number of vaccines in the vaccine schedule in a model like this.
In brief, Goldman and Miller added:
Next, using IMRs and vaccine doses derived from the same sources, linear regression analyses continued to be performed successively on each of the top 31, 32, 33,…. nations until the reported r-value was no longer statistically significant (at n = 47). The correlation coefficient (r) decreased from r = 0.70 (p < .0001) for n = 30 to r = 0.29 (p = .0504) for n = 47, as shown in Figure 3 and Table 3.
Concluding:
While our original study analyzed the top 30 nations with the US as the cutoff, an additional 16 nations (from Croatia #31 to Russia #46) could have been included in the linear regression of IMRs vs. the number of vaccine doses, and the findings would still have yielded a statistically significant positive correlation coefficient.
They present this as a test for their assumptions, but in reality what this graph really suggests is just how biased their original sample of 30 countries was, given that as they added nations one-by-one, their correlation coefficient got successively worse. Again, as we like to point out, “statistically significant” does not necessarily mean “significant,” particularly for datasets like this.
The last bit of Goldman and Miller’s “rebuttal” is a lot of projection:
The Bailey team indiscriminately combined highly developed and Third World nations without regard to confounding arising from heterogeneous data. Clusters of heterogeneous nations (due to variable socioeconomic factors) report widely differing IMRs yet prescribe the same number of vaccine doses for their infants. For example, Angola (with an IMR of 180.21) and Belgium (with an IMR of 4.44) both require 22 vaccine doses.
If Goldman and Miller weren’t antivaccine hacks, this observation should tell them something very important, namely that differences in IMR depend on many things and that their results don’t show an effect that can be correlated with the number of vaccine doses on their recommended vaccine schedule.
Basically, Miller and Goldman double down on their previous analysis and then handwave all sorts of complaints about the Bailey analysis. For example, they try to explain away Bailey’s finding that the results they got from their 30 nation subset of the 185 nations in the dataset were incredibly unlikely to result from a random sampling by stating that the “analysis is flawed because it mixed nations displaying heterogeneity of socioeconomic factors without regard to covariates.” This is the pot calling the kettle black given that the original Goldman and Miller analysis made nothing resembling a statistically legitimate attempt to control for confounders and covariates and the entire point of the Bailey analysis was to show how doing a truly random sample would be incredibly unlikely to generate the results that Goldman and Miller got.
Many of the rest of Goldman and Miller’s complaints are nitpicking in that what they cited as “deficiencies” would be incredibly unlikely to have converted an analysis implicating higher numbers of vaccines in a nation’s childhood vaccination schedule as not correlating with increasing IMRs to one that does. Indeed, as Bailey’s group shows, the opposite correlation, in which vaccines are protective against IMR (which is what has been known for a very long time), is far more likely to be the correct one.
Goldman and Miller also criticize Bailey for counting vaccines correctly (yes, I’m being sarcastic):
The number of vaccine doses for some nations is substantially miscounted. For example, seven infant vaccine doses are reported for Australia when the true value is 22 (as indicated by WHO/UNICEF) or 24 (as indicated by the immunization schedule published by the Australian government). Incorrectly calculated vaccine doses, whether due to the exclusion of subnationally distributed vaccines or a manual miscount, are problematic.
I quite literally laughed out loud when I read that passage, as I did with all the other anomaly hunting that Goldman and Miller did in nitpicking oddities in Bailey’s results. If I wanted to get Biblical, I could cite Matthew 7:3-5: “And why beholdest thou the mote that is in thy brother’s eye, but considerest not the beam that is in thine own eye?” (It is very rare that I quote the King James version of The Bible—or even The Bible in general—for anything, but it seems appropriate here.)
Finally, near the very end, Goldman and Miller start handwaving about “biological mechanisms” (that aren’t based in any actual biology), in order to make their antivaccine propaganda sound more compelling. For example, they pull out the hoary old antivax chestnut falsely blaming vaccines for SIDS, claiming that there “is credible evidence that a subset of infants may be at increased risk of sudden infant death shortly after being vaccinated.” (Again, there ain’t; if anything, the opposite is true and vaccines are likely protective against SIDS. At the very worst, they have no detectable effect on SIDS risk.) This not-so-dynamic duo even cites a Vaccine Court ruling:
On July 10, 2017, the US Court of Federal Claims [28] issued a decision with regard to a claim filed with the Vaccine Injury Compensation Program (VICP). A male infant, J.B., received seven vaccines at his four-month well-baby visit. On the following day, he died. The medical examiner stated that the cause of death was SIDS. His parents filed a petition under the VICP. Petitioners allege that as a result of receiving vaccines for diphtheria, tetanus, acellular pertussis, polio, Hib, pneumococcal, and rotavirus, J.B. passed away from SIDS.
After listening to expert testimony by Dr. Douglas C. Miller, a neuropathologist, Special Master Thomas L. Gowen concluded that the petitioners “have demonstrated by a preponderance of the evidence that the vaccines can and likely did play a critical role in this child’s death.”
Had I been a peer reviewer for this paper, I would have pointed out that the Vaccine Court sometimes makes mistakes (as it did in this case) and that the ruling was ultimately overturned, something Goldman and Miller somehow fail to mention. I wonder why.
Actually, I don’t. Miller and Goldman are antivaccine hacks. They’ve been publishing “studies” that erroneously come to the conclusion that vaccines are harmful for a very long time. Indeed, Gary Goldman states in his Cureus bio—wait, they have bios on Cureus?—that he is not a medical professional, and it shows. The same is true for Neil Miller. Apparently someone who contributed to this study, Walter Schumm, is listed as a statistician. Although it’s claimed that Schumm did an odds-ratio analysis, he is not credited as a co-author on this paper and is not even listed in the acknowledgments. More disturbingly, although the paper claims that Schumm did an odds-ratio analysis “whereby nations in our study were divided at the median IMR and total vaccine doses, controlling for several confounding variables (including low birth weight, child poverty, and breast feeding)” and found that none “of these factors lowered the original correlation below 0.62.” Of course, given that the original correlation of 0.70 was based on a clearly nonrandom and biased selection of nations, this additional analysis is basically the proverbial putting lipstick on a pig. It doesn’t change the essential lack of scientific validity of the original analysis.
Never having heard of Schumm before, I Googled and found that he is an emeritus professor in the Department of Applied Human Sciences at Kansas State University. I also note that he does not appear to have an advanced degree in statistics (or any degree in statistics), although he does still apparently teach basic statistics. To properly do the analyses claimed would require a bit more—shall we say?—advanced statistical skills. In any event, the best that I can say about Schumm after doing some searches about him is that he appears to possess expertise in social science research methodology, but there’s no good evidence that he has expertise to do an analysis like Goldman and Miller’s. A PubMed search on his name also reveals studies like this one concluding that “psupport of transgender children may temporarily reduce levels of poor mental health for some transgender children, but it does not appear to eliminate those problems for all transgender children” (as if anyone claims that gender-affirming care is effective at this 100% of the time). Then there was this one, in which Schumm claims to have found a “pro-homosexual bias” in the social science literature, and then in this letter he co-authored with Andre Von Mol in which he questioned research finding adverse health outcomes associated with sexuality orientation change efforts (better known as “conversion therapy”).
The bottom line is that, once again, antivax hacks gonna hack, and Goldman and Miller are antivax hacks. Their 2011 study was pure hack, and their defense of that study in 2023 is more of the same. They’re not interested in science. Rather, above all they are interested in promoting a message claiming that vaccines kill children.