From the very outset, the founders of Science Based Medicine have have emphasized the importance of plausibility in the critical evaluation of scientific claims in medicine. What exactly does “plausibility” mean, and how should we apply it in science? My simple definition of plausibility would be “the likelihood that a premise is true.” The application in science is a little more complicated.
Consciously or unconsciously, we all consider plausibility in interpreting events in our lives. For example, if one of your coworkers showed up late for work and grumbled about a traffic jam, you would likely accept his story without question. If, instead, the same coworker attributed his tardiness to an alien abduction, you would not be so charitable. In each case, he has provided the same level of evidence: his anecdotal account. You are likely to accept one story and reject the other because of a perceived difference in the plausibility. The skeptic’s mantra “Extraordinary Claims Require Extraordinary Evidence” expresses this concept in a qualitative way.
Evidence-based medicine has traditionally ignored plausibility when interpreting the evidence for a medical intervention. Science-based medicine, as envisioned by the creators of this blog, includes plausibility when making these judgements.
Since experiment research employs rigorous controls, and statistical criteria, you might assume that plausibility is not an issue, however, this is not entirely true. An article written by John Ioannidis entitled “Why Most Published Research Findings Are False” is cited frequently as a reference for the impact of plausibility on the interpretation of research results. This article enumerates numerous factor leading to erroneous research conclusions. Most of them have been dealt with on this blog at one time or another. To me, the most eye-opening aspect of the paper was a quantitive approach to the influence of plausibility in interpreting positive research findings. I was never taught this approach in medical school, or in any other venue. When it comes to implausible hypotheses, the traditional P-value can be very misleading.
As good as Ioannidis’ article is, it is not easy reading for the statistically or mathematically challenged. What I attempt to do in this post is to demonstrate the importance of plausibility in graphic format, without a lot of complex math. If you can grasp the concepts in this post, you will have an understanding that many researchers, and consumers of research, lack.
Research vs Reality
When scientists design research studies, they hope to obtain a result that leads them to a better understanding of reality. In medicine, studies are frequently undertaken to investigate the effectiveness of a treatment strategy.
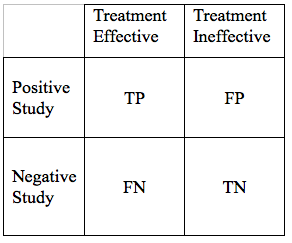
The result of such a study can intersect with reality in 4 ways:
- True Positive (TP): The treatment works and the study demonstrates this effectiveness
- False Negative (FN): The treatment works, but the study fails to demonstrate this effectiveness
- False Positive (FP): The treatment does not work, but the study shows it to be effective
- True Negative (TN): The treatment does not work, and the study suggests it is not effective.
We can display the possible study results in a simple grid:
We would hope that all our results would be True Positives, or True Negatives. If that were the case, all research studies would be conclusive. Unfortunately, science is never that simple. There are ways to reduce, but not eliminate False Negative, and False Positive Results. As we go through the elements of a hypothesis, and study design, we will modify the table above in a way that the area of each of the 4 cells in the grid, is proportional to the likelihood of each particular outcome.
Lets start with a very basic study design. We are exploring a new treatment for disease X. We would consider the study positive, if the treatments is associated with improved outcomes at some pre-specified level of statistical significance.
Now lets look into the study details that can influence the relative likelihood of the 4 outcomes: TP, FN, FP, and TN.
Study Power
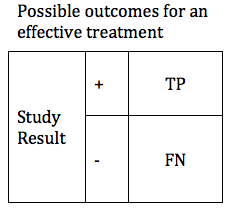
In designing a study, it is valuable to look at hypothetical results for a treatment that is effective, and for a treatment that is not effective.
We can first consider the possible results if, in reality, our treatment is effective. In this case we will obtain one of two possible results: True Positive or False Negative. These can be shown in a simple table.
There are design considerations that can increase the probability of obtaining a true positive result. The likelihood that a trial of an effective treatment will yield a TP result is called the study Power (also known as Sensitivity). Power can be expressed as a number between 0 and 1 (if you are more comfortable working in percentages, just multiply the Power times 100%). The higher the sensitivity, the more likely it is that we will confirm the effectiveness of our treatment. We can modify the table to include the Power of the study. The height of the TP and FP bars represent the relative likelihood of each of the 2 possible outcomes.
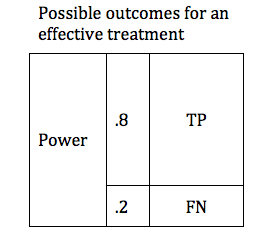
The Table above shows a study designed to find a TP result 80% of the time for an effective treatment. We would say that this study has a Power of 0.8 . In medical research 0.8 is considered quite a powerful study, and would usually require a large number of patients (large sample size).
Specificity and P values
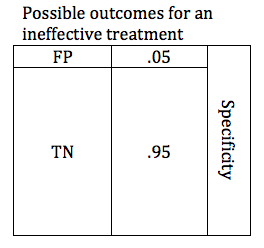
In the previous section, we looked at possible outcomes for an effective treatment. Now we will look at possible outcomes for an ineffective treatment. If our treatment is ineffective, we will obtain one of 2 possible outcomes: True Negative or False Positive.
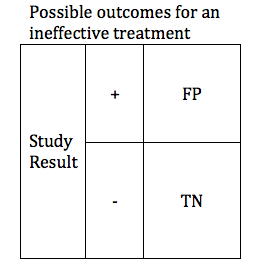
Researchers are careful to avoid false positive results. The parameter that defines the likelihood that a study will obtain a negative result if the drug is ineffective is known as the Specificity. Like power, specificity is expressed as a number between 0 and 1 (or between 0% and 100%). A .95 specific study will obtain a True Negative result for an ineffective treatment 95% of the time, and will obtain a False Positive result 5% of the time.
It is more common for researchers to talk about the false positive rate rather than the specificity. Researchers usually refer to the critical P-value rather than the Specificity. P-value and specificity convey exactly the same information, and can readily be derived from one-another. Specificity = 1 – P
When designing a study, the investigators select a critical P value. In order to accept the results of study favoring the study treatment, the P value must be at or below the predefined critical P value. For most studies in medicine, the critical P value is .05 (Specificity .95). This means that if they are studying an ineffective treatment, there is a 1 in 20 chance that they may declare this ineffective treatment effective. The lower the critical P value, the less likely a study is to find a false positive, but the tradeoff is that it becomes harder to find a true positive. The table below shows depicts a study with a critical p value of .05. The relative size of the boxes represents the likelihood of FP and TN results when a study premise is false.
Now lets combine the possibilities for effective and ineffective treatments. We can combine the 2 tables into one.

In the table above, the cells representing the TP, FN, FP, and TN outcomes are approximately equal size. Below is a more realistic representation of a study with a Power of .8, and a critical P of .05.

Now we have done our study, and analyzed the results. We have achieved our target P value of .05. What then is the likelihood that this positive study is a true positive? Since our P value is .05, we can be 95% sure that our study is correct, right? WRONG! Remember, the P value tells us something about the False Positives. The P value alone tells us nothing about the chances of a True Positive result! This is a very critical concept, and one that is poorly understood by many people.
Since our study power was .8, then we can be 80% sure that our result is true, right? Unfortunately no. The power tells us something about true positives relative to false negatives. We already know that our study is positive, but we want to know whether it is a True Positive or a False Positive.
Plausibility, Prior Probability, and Positive Predictive Value
We need a parameter that can help us distinguish between a true positive and a false positive result. Such a parameter is known as the Positive Predictive Value (PPV). The PPV considers both the True Positives and False Positives, and calculates the probability that our positive result is a True Positive. As with the other parameters, PPV is expressed as a number between 0 and 1, and calculated by the expression:
PPV = TP / (TP+FP)
But there is one more critical piece of information necessary to calculate the PPV of our study.
The Prior Probability is the likelihood, prior to beginning the study, that our premise is true. Prior Probability is a quantitative assessment of plausibility. Like sensitivity and specificity, prior probability can be expressed as a number between 0 and 1. A prior probability of 0 means that there is zero chance that the premise is true. A prior probability of 1 means that the truth of the premise is a certainty. In our table, we can display prior probability as the relative widths of the columns labeled “Treatment effective” and “Treatment ineffective”
For the study of our drug, lets assume the drug has a prior probability of .5, meaning that going into our study, there is a 50/50 chance that the drug is effective. This is probably a reasonable estimate for a drug with a valid preclinical foundation, and promising phase 2 data. In the table, a prior probability of 50% is reflected by the fact that the columns for “Treatment Effective” and “Treatment Ineffective” are of equal width.

Just to establish myself as Über Geek among SBM contributors I have created a Positive Predictive Value Calculator widget. The values are pre-populated for the problem above, but you can enter any values you wish (provided they are between 0 and 1). Remember: Sensitivity = Power; and Specificity = 1-P.
In truth we can rarely, if ever, calculate an accurate prior probability for any given premise. Even though we cannot come up with a truly accurate prior probability, it is instructive to explore the interaction between prior probability and positive predictive value.
When it comes to low prior plausibility, homeopathy is the go-to treatment ; a status it has earned for very good reason. For homeopathy to work, numerous principles of chemistry and physics would have to be wrong. Not just wrong, but spectacularly wrong. Established principles of physiology and pharmacology would also have to be wrong. Most of us would estimate the prior probability of any clinical claim of homeopathy for any indication as infinitesimal (irony intended).
Lets assign a very generous prior probability of .05 (5% likelihood that homeopathy is effective). If we factor this into a study with a power of .8 and a critical P value of .05, we come up with a table that looks like this. (note, not drawn to exact scale to preserve readability).

By adding prior probability we have changed the width of the columns to reflect the difference in probability of the various outcomes. Remember, the columns on the left represent the possible outcomes of an effective treatment, and the columns on the right represent possible outcomes of an ineffecive treatment. The area of each cell represents the relative likelihood of that result, given the parameters specified. A study with the parameters shown above, if it is fair, and free of bias has a low chance of finding any positive result. If the result is positive, however, the areas of the TP and FP cells are approximately the same size, meaning that they have a similar likelihood.
The positive predictive value of this study is reflected by the area of TP divided by the area of TP+FP. If we calculate the PPV this study we come up with a value of 0.46. So given a powerful study, and a VERY charitable prior probability for homeopathy, a positive clinical trial result for homeopathy has positive predictive value a little worse than a coin toss. If you lower the prior probability to more accurate .01 (1%) the positive predictive value becomes .14.
The Big Picture
Everything we have discussed can be summarized in the figure below. This depicts the relationship between Positive Predictive Value and Prior Probability for research studies of various powers. Notice that at the left side of the curve, where prior probabilities are very low, the positive predictive value approaches zero. Even for a powerful study design, when the prior plausibility is low, the positive predictive value is low. For less powerful studies, the positive predictive value is even weaker. We do not need agree on an exact value for the prior plausibility of homeopathy to see that any single positive clinical trial is virtually meaningless.

The horizontal axis represents the Prior Probability. The vertical axis represents Positive Predictive Value. The blue, green, and red curves represent results for studies with powers of .8, .5. and .25, respectively. All results assume a critical P value of .05.
The take-home message of the graph above is this: even for a well designed, powerful study, if the premise is highly unlikely, a positive result does not give us convincing evidence that the premise is true. For studies with weaker power, the results are even less persuasive.
So why do extraordinary claims require extraordinary evidence? Because for implausible claims, ordinary evidence is highly unreliable. A single positive study with a P value of .05 is ordinary evidence. For a very implausible hypothesis, a result of this sort is quite likely to be a false positive.