As I’ve written more times than I can remember, cancer is complicated. Really complicated. You just won’t believe how vastly, hugely, mind-bogglingly complicated it is. I mean, you may think balancing your checkbook is complicated, but that’s just peanuts to cancer. (Apologies to Douglas Adams.) First of all, contrary to the way alternative medicine mavens (and all too many people in general) portray it, cancer isn’t just one disease; it’s hundreds. Even cancer arising from the same organ might not be one disease. For instance, one study of a particularly aggressive subtype of breast cancer found that no two cancer genomes were the same, and, thanks to the power of evolution, the genetically unstable cancer cells lead to increasingly heterogeneous tumors as they grow, such that one part of a cancer might be significantly different from another part and metastases can be even more different. Phylogenetic trees can even be constructed. Cancer often involves many more cell types than just the cancer cell as well, not to mention the contribution of the immune system and metabolism in addition to the various genetic derangements in the cancer cells themselves.
One area of cancer research where this complexity becomes apparent is cancer disparities. I’ve discussed how lifestyle and diet can increase or reduce one’s risk, but there’s a whole other layer to the question of environmental effects on cancer risk and mortality. For instance, where you live matters. Your race or ethnicity can matter. Your socioeconomic status can matter. As the National Cancer Institute notes:
Cancer disparities (sometimes called cancer health disparities) are differences in cancer measures such as:
- incidence (new cases)
- prevalence (all existing cases)
- mortality (deaths)
- morbidity (cancer-related health complications)
- survivorship, including quality of life after cancer treatment
- burden of cancer or related health conditions
- screening rates
- stage at diagnosis
Cancer disparities can also be seen when outcomes are improving overall but the improvements are delayed in some groups relative to other groups.
Although disparities are often considered in the context of race/ethnicity, other population groups may experience cancer disparities. These include groups defined by disability, gender/sexual identity, geographic location, income, education, and other characteristics.
And here’s a video primer:
The one disparity that interests me as a breast cancer surgeon is the increased prevalence of triple negative breast cancer, a particularly nasty subtype, in premenopausal African American women, because our cancer center is in an area where half of our patients are African-American.
Basically, cancer disparities are where the rubber hits the road in a practical manner, as genetics, environment, lifestyle, and access to care can all impact who dies from cancer and who survives. So, for a change of pace (and because it interested me), I thought I’d look at a study of cancer disparities just published in JAMA Network Open on Friday that attempts to quantify cancer disparities. Its investigators include researchers from Yale and the University of Chicago, who report rather striking disparities in cancer death rates by county in in the US related to socioeconomic status.
The authors note:
Advances in cancer prevention, diagnosis, and treatment have led to rapid reductions in cancer mortality in the United States, with cancer death rates decreasing from 240 per 100,000 person-years in 1980 to 192 per 100 000 person-years in 2014.1-3 Reductions in cancer mortality, however, are not synonymous with reductions in cancer disparities—perhaps in part because of variation in access to advances in care. Indeed, cancer disparities remain substantial in the United States by geographic area and by socioeconomic status.4-6 The socioeconomic cancer disparities are notable in particular because they may worsen over time owing to the soaring costs of cancer diagnosis and treatment. Thus, there are major concerns about US socioeconomic disparities in cancer deaths.
To estimate cancer disparities, the investigators carried out a cross-sectional study assessing cancer disparities by county. They included all counties with cancer death rates available from 2014 in a database published by the Institute for Health Metrics and Evaluation. The database is based on data from the National Center for Health Statistics death record data and curated to eliminate “garbage codes, which are implausible or nonspecific causes of death.” The authors also linked the cancer death rate of each county to the median household income from 2012 in order to allow a two year lag prior to the primary outcome measure in 2014. The use of MHI is justified because it’s widely used and a readily available marker of socioeconomic status and because the authors expected it to have the most relevance to cancer death rates because of the financial toxicity of cancer.
So the primary outcome of this study was the age-adjusted cancer death rate per 100,000 person-years. Then:
To identify the factors that may serve as mediators of the association between the exposure and the outcome at the county level, we used time-lagged variables from the Robert Wood Johnson Foundation County Health Rankings conceptual model (eTable 1 in the Supplement). This model systematically evaluates and ranks counties according to a series of health risk factors that are selected on the basis of their validity and their importance in public health.17,18 It then groups these health factors into domains: health risk behaviors, clinical care factors, socioeconomic factors, and physical environment factors.18 We added a fifth domain to include cancer-relevant health policies—for example, the number of state-level mandates for insurance coverage of cancer care. Last, we added other factors, such as the presence of a comprehensive cancer center nearby, that were not included in the County Health Rankings model but were expected to be relevant to cancer outcomes.19,20 We obtained factors from multiple sources, including the Centers for Disease Control and Prevention, the American Lung Association, the National Cancer Institute, and the American Society of Clinical Oncology (eTable 1 in the Supplement).21-26
Counties were stratified into quartiles: low- (lowest quartile), medium- (middle quartiles), and high-income (highest quartile) groups. Regression models were used to identify multiple factors associated with the disparities found and to test the hypothesis that the various factors chosen above may serve as mediators of disparities between counties. The authors also used the sums of the values of the possible mediators to calculate a standardized risk score that they called the disparity risk index.
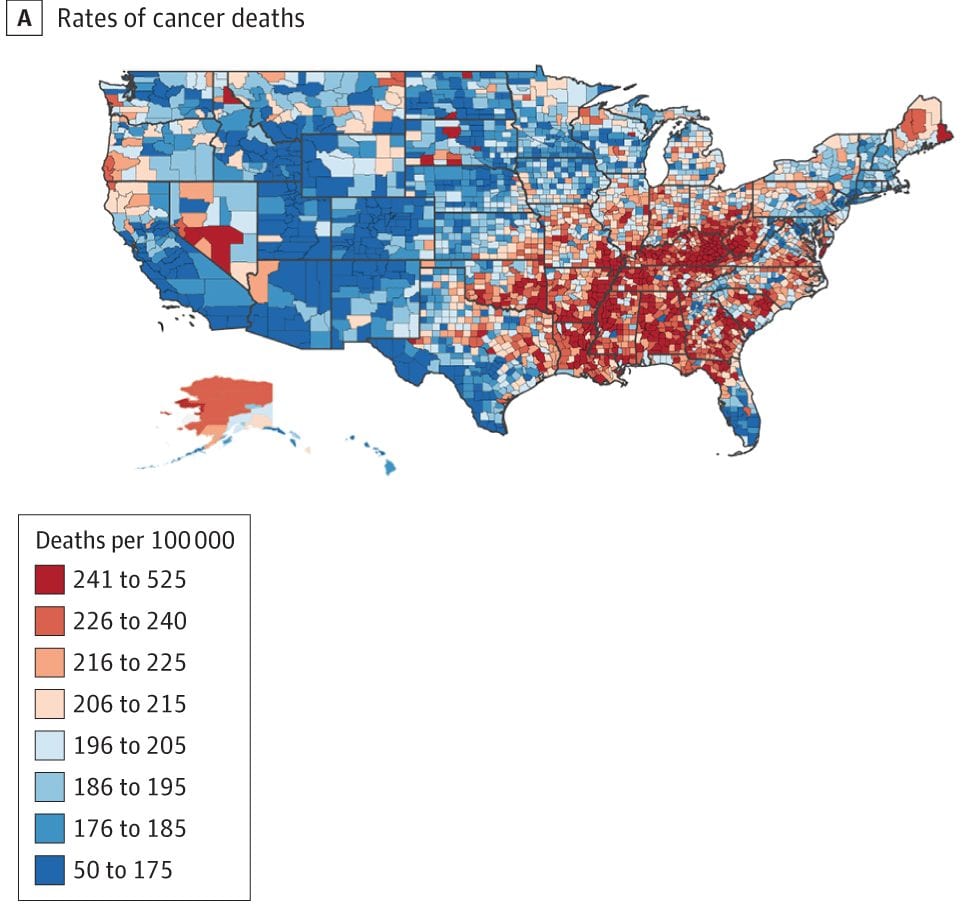
Not surprisingly, there were significant differences in cancer mortality found. A total of 3,135 counties were examined, with a median household incomes ranging from $22,126 to $121,250 per year. There were also striking differences in cancer death rates, which varied widely across counties, from 70.7 to 503.5 deaths per 100,000 person-years, the mean being 206.4. As one might predict, low income counties (median income $33,445) had a higher proportion of residents who were non-Hispanic black, lived in rural areas, or reported poor or fair health compared to high income counties (median income $55,780). The mean (SD) cancer death rate was 185.9 (24.4) per 100 000 person-years in high-income counties, compared with 204.9 (26.3) and 229.7 (32.9) per 100,000 person-years in medium- and low-income counties, respectively. There were also significant variations in cancer death rates by income group, with a mean death rate ± standard deviation of 229.7 ± 32.9 deaths per 100,000 person-years in the counties in the lowest quartile counties versus 204.9 ± 26.3 deaths per 100,000 person-years in the middle quartile counties and 185.9 ± 24.4 deaths per person-years in the highest quartile counties. The authors found that the geographic clusters, or hot spots, with the highest cancer death rates were in the South, including the Mississippi River Delta, in addition to Appalachia (n = 507 counties in hot spots at a threshold of P < .05, Figure 2). There were many overlaps between these hot spots and low-income counties, as shown below in Figure 2 from the paper.
The authors tested various factors for whether they could be mediators of the observed disparities. A total of 38 factors were tested in a single-mediator model, which led 19 factors to meet the criteria for being included in a multi-mediator model. Of these, eight retained significance in the fully adjusted mediation model, suggesting that at least these eight county-level factors could be serving as mediators of the observed county-level socioeconomic cancer disparities. The authors note that these factors are important because they correlate with county-level MHI and because they could well fit into relevant pathways known to affect cancer risk and outcome. Of these, three factors were health risk behaviors (rates of obesity, smoking, and physical inactivity); two were health policies (smoke-free laws and the state Medicaid fee index, which is a state-level ratio of provider payments from Medicaid vs Medicare); and one was a health environment factor (food insecurity, defined as the percentage of the population that lacks a reliable source of food). The effects are shown on the graph below, specifically what percentage of the disparity observed is explained by each factor:
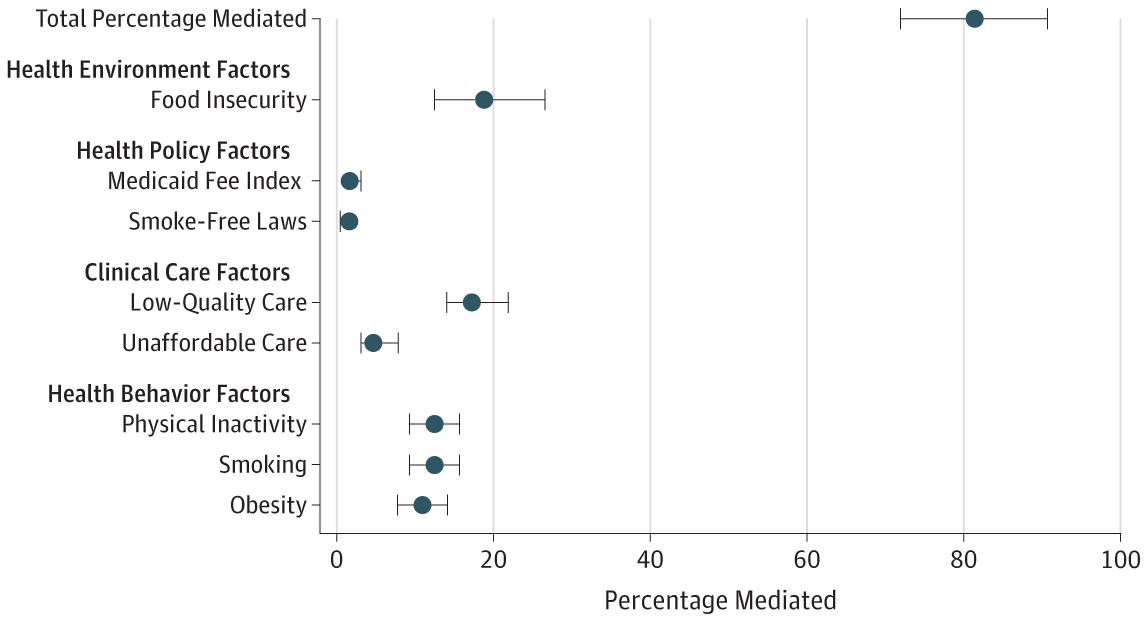
Factors associated with cancer disparities due to socioeconomic status.
As you can see by eyeballing the graph, much of the disparity can be explained by these factors, Indeed, the authors calculated that, in aggregate, these factors explained more than four-fifths (81.25%, to be precise) of the association between county-level median incomes and cancer death rates. As should be done, the statisticians did various sensitivity analyses, to see if the method choosing the variables affected the results. It didn’t. Different methods of variable selection led to similar models. So, basically, the final multivariable model “seemed to provide an accurate and robust estimate of the degree to which the factors may explain the disparities”, at least for this dataset and these variables.
Of course, this is an epidemiological study. Since it uses aggregated data and doesn’t look at individual-level date (e.g., MHI of individuals), it’s prone to the ecological fallacy (making inferences about the nature of individuals based on inference from the group to which they belong, most commonly deducing correlation between individual variables from the correlation of the variables collected for the group). Also, these are aggregated cancer death rates; they’re not broken out by cancer type. This means that large differences between the incidences of different cancers by county could confound results, although such confounding would provide interesting fodder for further research. In any event, this study is more hypothesis-generating for some correlations, although certainly finding that smoking, obesity, and physical inactivity are the strongest possible mediators of the cancer disparities is confirmatory of a lot of what we know already.
Two other major findings of this study included the finding that food insecurity and access to quality medical care are associated with higher cancer death rates. The authors note:
There are multiple ways in which these 2 factors may account for disparities in cancer deaths. For example, low-quality clinical care may lead to delays in the diagnosis and treatment of cancer, and food insecurity may increase the incidence of certain cancers in populations due to poor nutrition, even if obesity rates are similar. Efforts to target nonbehavioral mediators might be useful in light of evidence that addressing health risk behaviors is necessary but not sufficient if the ultimate goal is to eliminate health disparities.46,47 In addition, the issue of regular access to healthy foods, or food security, might warrant further consideration in future studies of cancer disparities. This is because studies suggest that food insecurity is correlated with poor health,48 high costs,49 and obesity—a key risk factor for cancer.10 In addition, because obesity is a risk factor for diabetes and cardiovascular disease, efforts to address it might lead to substantial gains in population-level health outcomes.
There’s also this:
Finally, to address disparities, it may be critical to maintain policies that are associated with better outcomes in low-income communities. For example, efforts to limit the expansion of Medicaid may undermine efforts to lessen socioeconomic cancer disparities, in part because the states with vs without Medicaid expansions have had larger improvements in screenings for and early detections of cancer.50,51 Our study adds to these findings by suggesting that limited access to affordable care is a mediator of cancer disparities, at the same time as many of the low-income counties with the highest mortality rates are in the states that eschewed the expansion.
I realize that people don’t like it when we get political here, even if it’s a little bit political, but the fact that the US, alone among developed nations, does not have a system of universal health insurance for its citizens virtually guarantees major disparities. At the very minimum, it means that existing disparities are not ameliorated. Disparities research is a reminder that it’s impossible to separate politics from medicine, because science-based public health care policies will inevitably mean making choices in law and regulation. Those choices are inherently political. Also, money and income matter. They matter a lot.
Ameliorating disparities in cancer outcome and incidence is also very difficult, because so many factors affect them. There are biological differences among populations, socioeconomic differences, differences in environmental exposures, differences in health behaviors, differences in so many things, that it’s hard to tell how much of which disparity is likely to be caused or mediated by what factor. Thus designing and implementing strategies to reduce these disparities are among the most difficult challenges cancer professionals face.